Unlock the full potential of your Android app builds with Bitrise Build Cache for Gradle and Bitrise Insights. Our latest feature updates bring you enhanced metrics and insights to improve your cache hit rate and significantly reduce build times. In this blog post, we'll explore how you can identify and optimize cache hits using our user-friendly UI and colorful trendlines. Let's dive in!
Note: This feature is available to users using the Bitrise Build Cache for Gradle
Understanding cache hit rate
The cache hit rate is a crucial metric that indicates the percentage of times a build artifact is found in the cache. A high cache hit rate signifies effective caching of frequently used dependencies and build artifacts, leading to substantial reductions in build times. Conversely, a low cache hit rate suggests room for improvement.
Where to access cache hit rates in Bitrise Insights
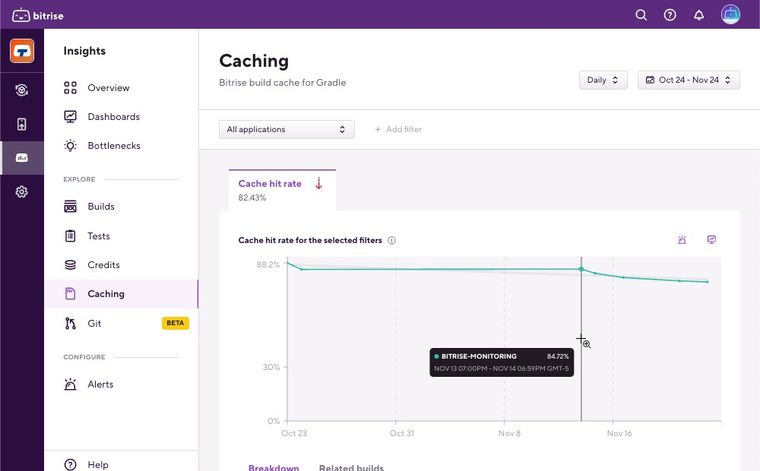
When utilizing Bitrise Build Cache for Gradle, accessing the cache hit rate is a breeze. Simply log into Bitrise Insights, navigate to the Explore section, and click on Caching. Here, you can drill down into your app's cache hit rate and identify areas that require attention.
Dive into Bitrise Insights and identify root causes for low cache hit rates
Just as your app is structured into Pipelines, Stages, Workflows, Steps, and Build Tasks, Bitrise Insights empowers you to drill down into each component and identify cache hit rate issues with ease. Here’s how.
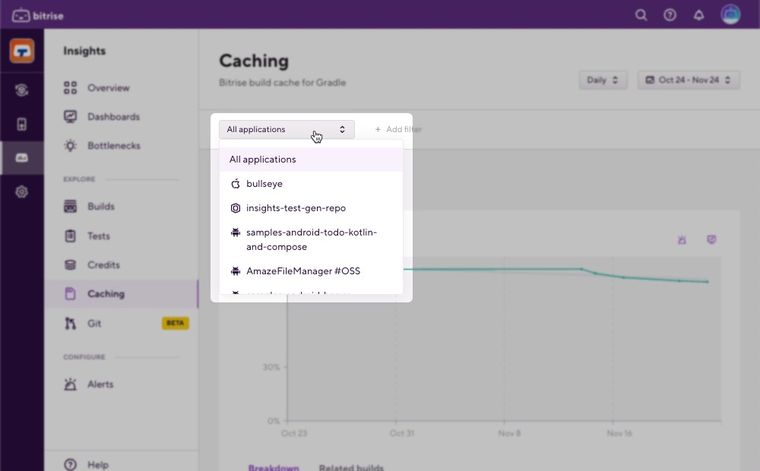
1. Select your app from your workspace: If you have multiple apps in your workspace, start by selecting the desired app from the All Applications dropdown menu. Unsure about which app to choose? Look out for the app with the lowest cache hit rate indicated by the colorful trendline.
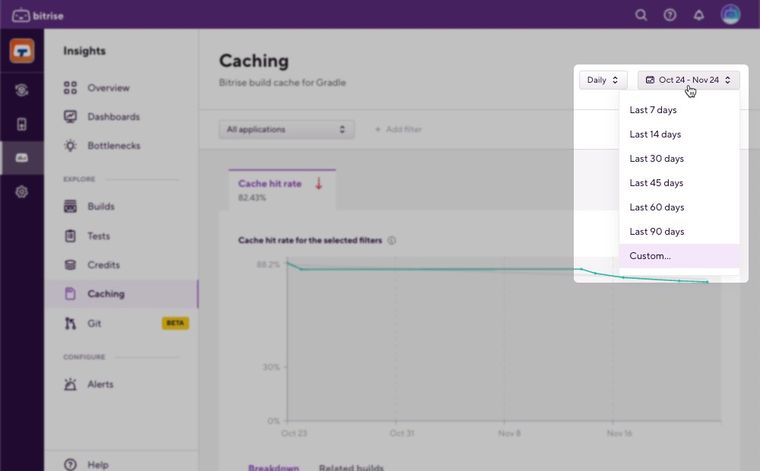
2. Explore Cache Hit Rate Trends: By default, Bitrise Insights presents the cache hit rate for the past 14 days on a daily basis. However, you can adjust the date range to view trends on a weekly, monthly, quarterly, or yearly basis.
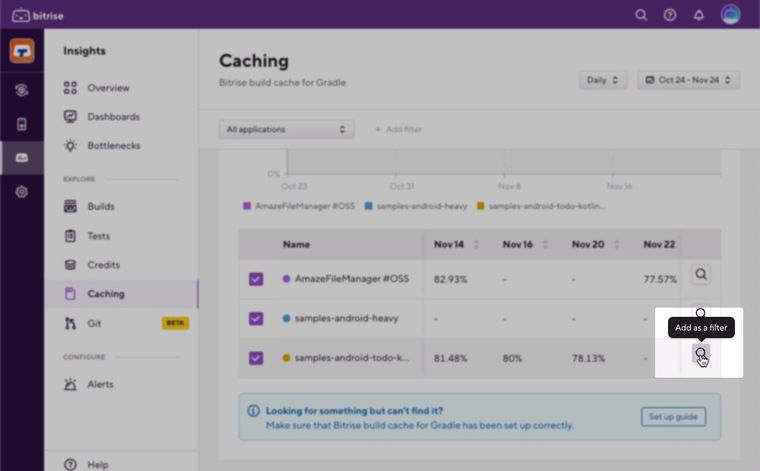
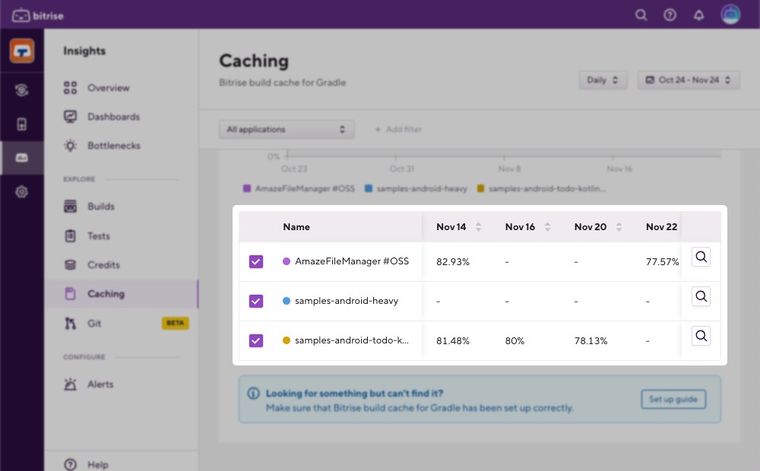
3. Analyze the Breakdown Chart: The Breakdown chart provides an overview of the cache hit rate per app, with color-coded trendlines highlighting the apps with the lowest cache hit rates. Click on the 🔎 icon to drill down further into the app using the Breakdown Table that sits underneaths the Breakdown Chart.
4. Analyze cache hit rate trends by Pipelines, Stages, Steps: Within the selected app, you can examine cache hits per pipeline. The line graph offers a quick overview of the workflows with the lowest-performing cache hits, enabling you to identify problematic pipelines. You can then explore individual stages and steps to pinpoint the exact tasks causing low cache hit rates. Clicking into a Step will reveal Gradle tasks and cache hit data. Note: The Breakdown Table for pipelines that sits underneath the chart will provide you with more info on standalone pipeline data for your selected date range.
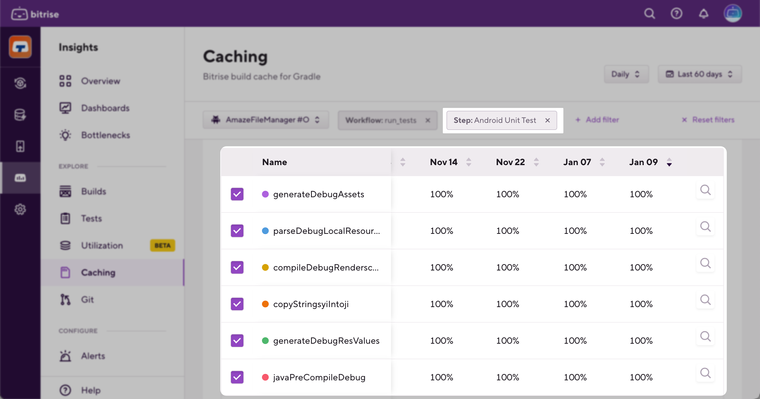
5. Analyse cache hit rate trends by task
Typically, your builds on Gradle will have several ‘tasks’. Bitrise Insights let you see the cache hit rate at the task-level, which can be quite powerful to analyse which tasks are being not being cached. Using this info, you can further optimise your build cache configuration.
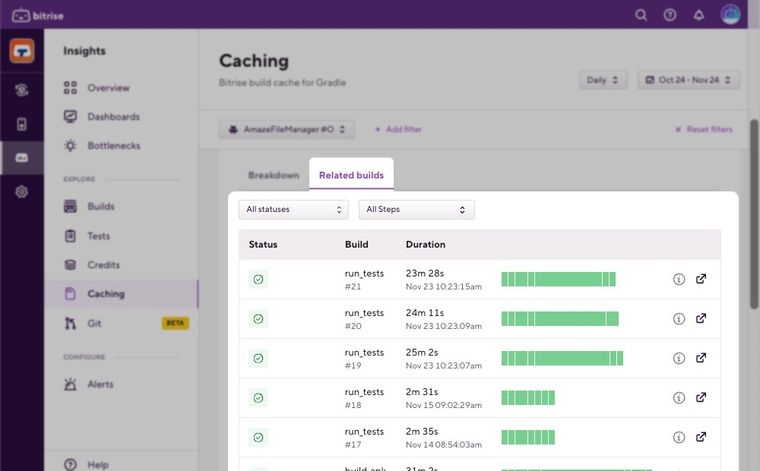
6. Utilize Related Builds and Build Logs: Once you've identified the tasks and steps responsible for low cache hits, navigate to the Related Builds tab. Filter for the specific step to access the corresponding build log. Analyzing the build log details helps you understand the root cause behind the cache hit rate issues.
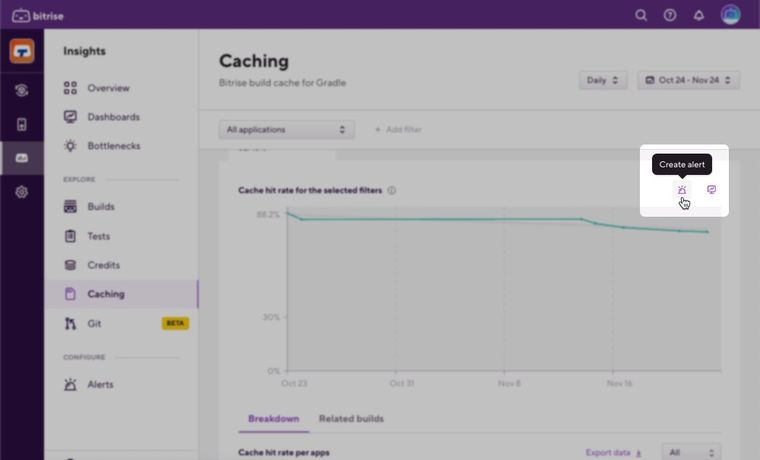
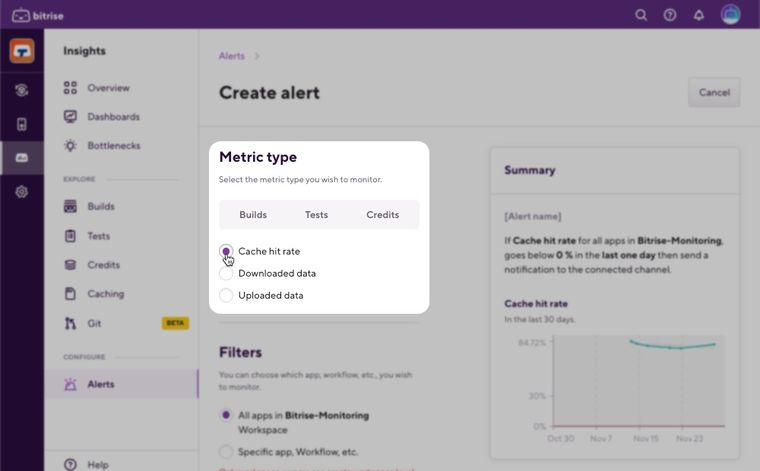
Proactive measures with Alerts
Set up proactive Alerts to stay ahead of cache hit rate issues. Receive notifications when your cache hit rate falls below a certain threshold, empowering you to take action promptly. Alerts can be configured to notify you via Slack or email, ensuring you're always in the loop.
Exciting upcoming updates
In the near future, we'll be introducing two new features to further enhance your build performance analysis. Gradle Task Duration will provide insights into task runtimes, allowing you to optimize build configurations. Additionally, network usage metrics will shed light on data download and upload during builds, helping you identify potential inefficiencies.
Unlock the Power of Bitrise Build Cache with Bitrise Insights
Bitrise Build Cache empowers you to store and reuse outputs from previous CI builds, dramatically reducing build times. With both remote and local cache capabilities, it optimizes performance across your development environment. Enjoy up to 10x faster builds and an improved developer experience while freeing up valuable resources.
Ready to harness the full potential of Bitrise Build Cache for Gradle with Bitrise Insights? Whether you're using the free, trial, or paid version of Bitrise Insights, and are a Bitrise Build Cache for Gradle user, you’ll have access to cache hit rate metrics. Book a demo with our team and transform your Android app builds into a streamlined and efficient process with Bitrise Build Cache for Gradle and Bitrise Insights.
Get started for free
Get a 30-day free trial and join the 400,000+ mobile developers who already love Bitrise.
Start free trial