With our Dashboards feature, you can easily track and keep tabs on the most important metrics and KPIs all from a single page within Bitrise Insights. But, what if you wanted a warning of some sorts? When you get an alert sent to you when something seems off, it may provide you with the necessary information about what is happening — but what is the effect of the detected change? Well, we’ve got you covered. We recently launched Alerts, a new feature in Bitrise Insights that notifies you when changes are detected in your most important (pre-set) metrics and KPIs.
About Alerting
With the new Dashboards feature, you can now track all the most important metrics and KPIs you have on a single page. For most of these metrics, you probably have a target in mind where you’d want to know if the metric crosses that threshold, for example, when the build time of an app’s workflow goes over 15 minutes.
Up until now, to know if you crossed that threshold, you had to open the related Dashboard and check the metrics periodically. If you’re doing this frequently, we have good news for you! With the new Alerts feature, you can get notified without visiting the Dashboards or Explore pages!
What's more, you can set a target alert for all the metrics and charts which you can see on the Explore pages, with the same filters that you can use on the Explore and Dashboards pages. Meaning, alerts can be very specific to what you are tracking/want to track. No matter what you want to keep an eye on, you can rest assured that Bitrise Insights will proactively notify you if any of your most important metrics would go over the threshold you set.
How to set up Alerting with Bitrise Insights
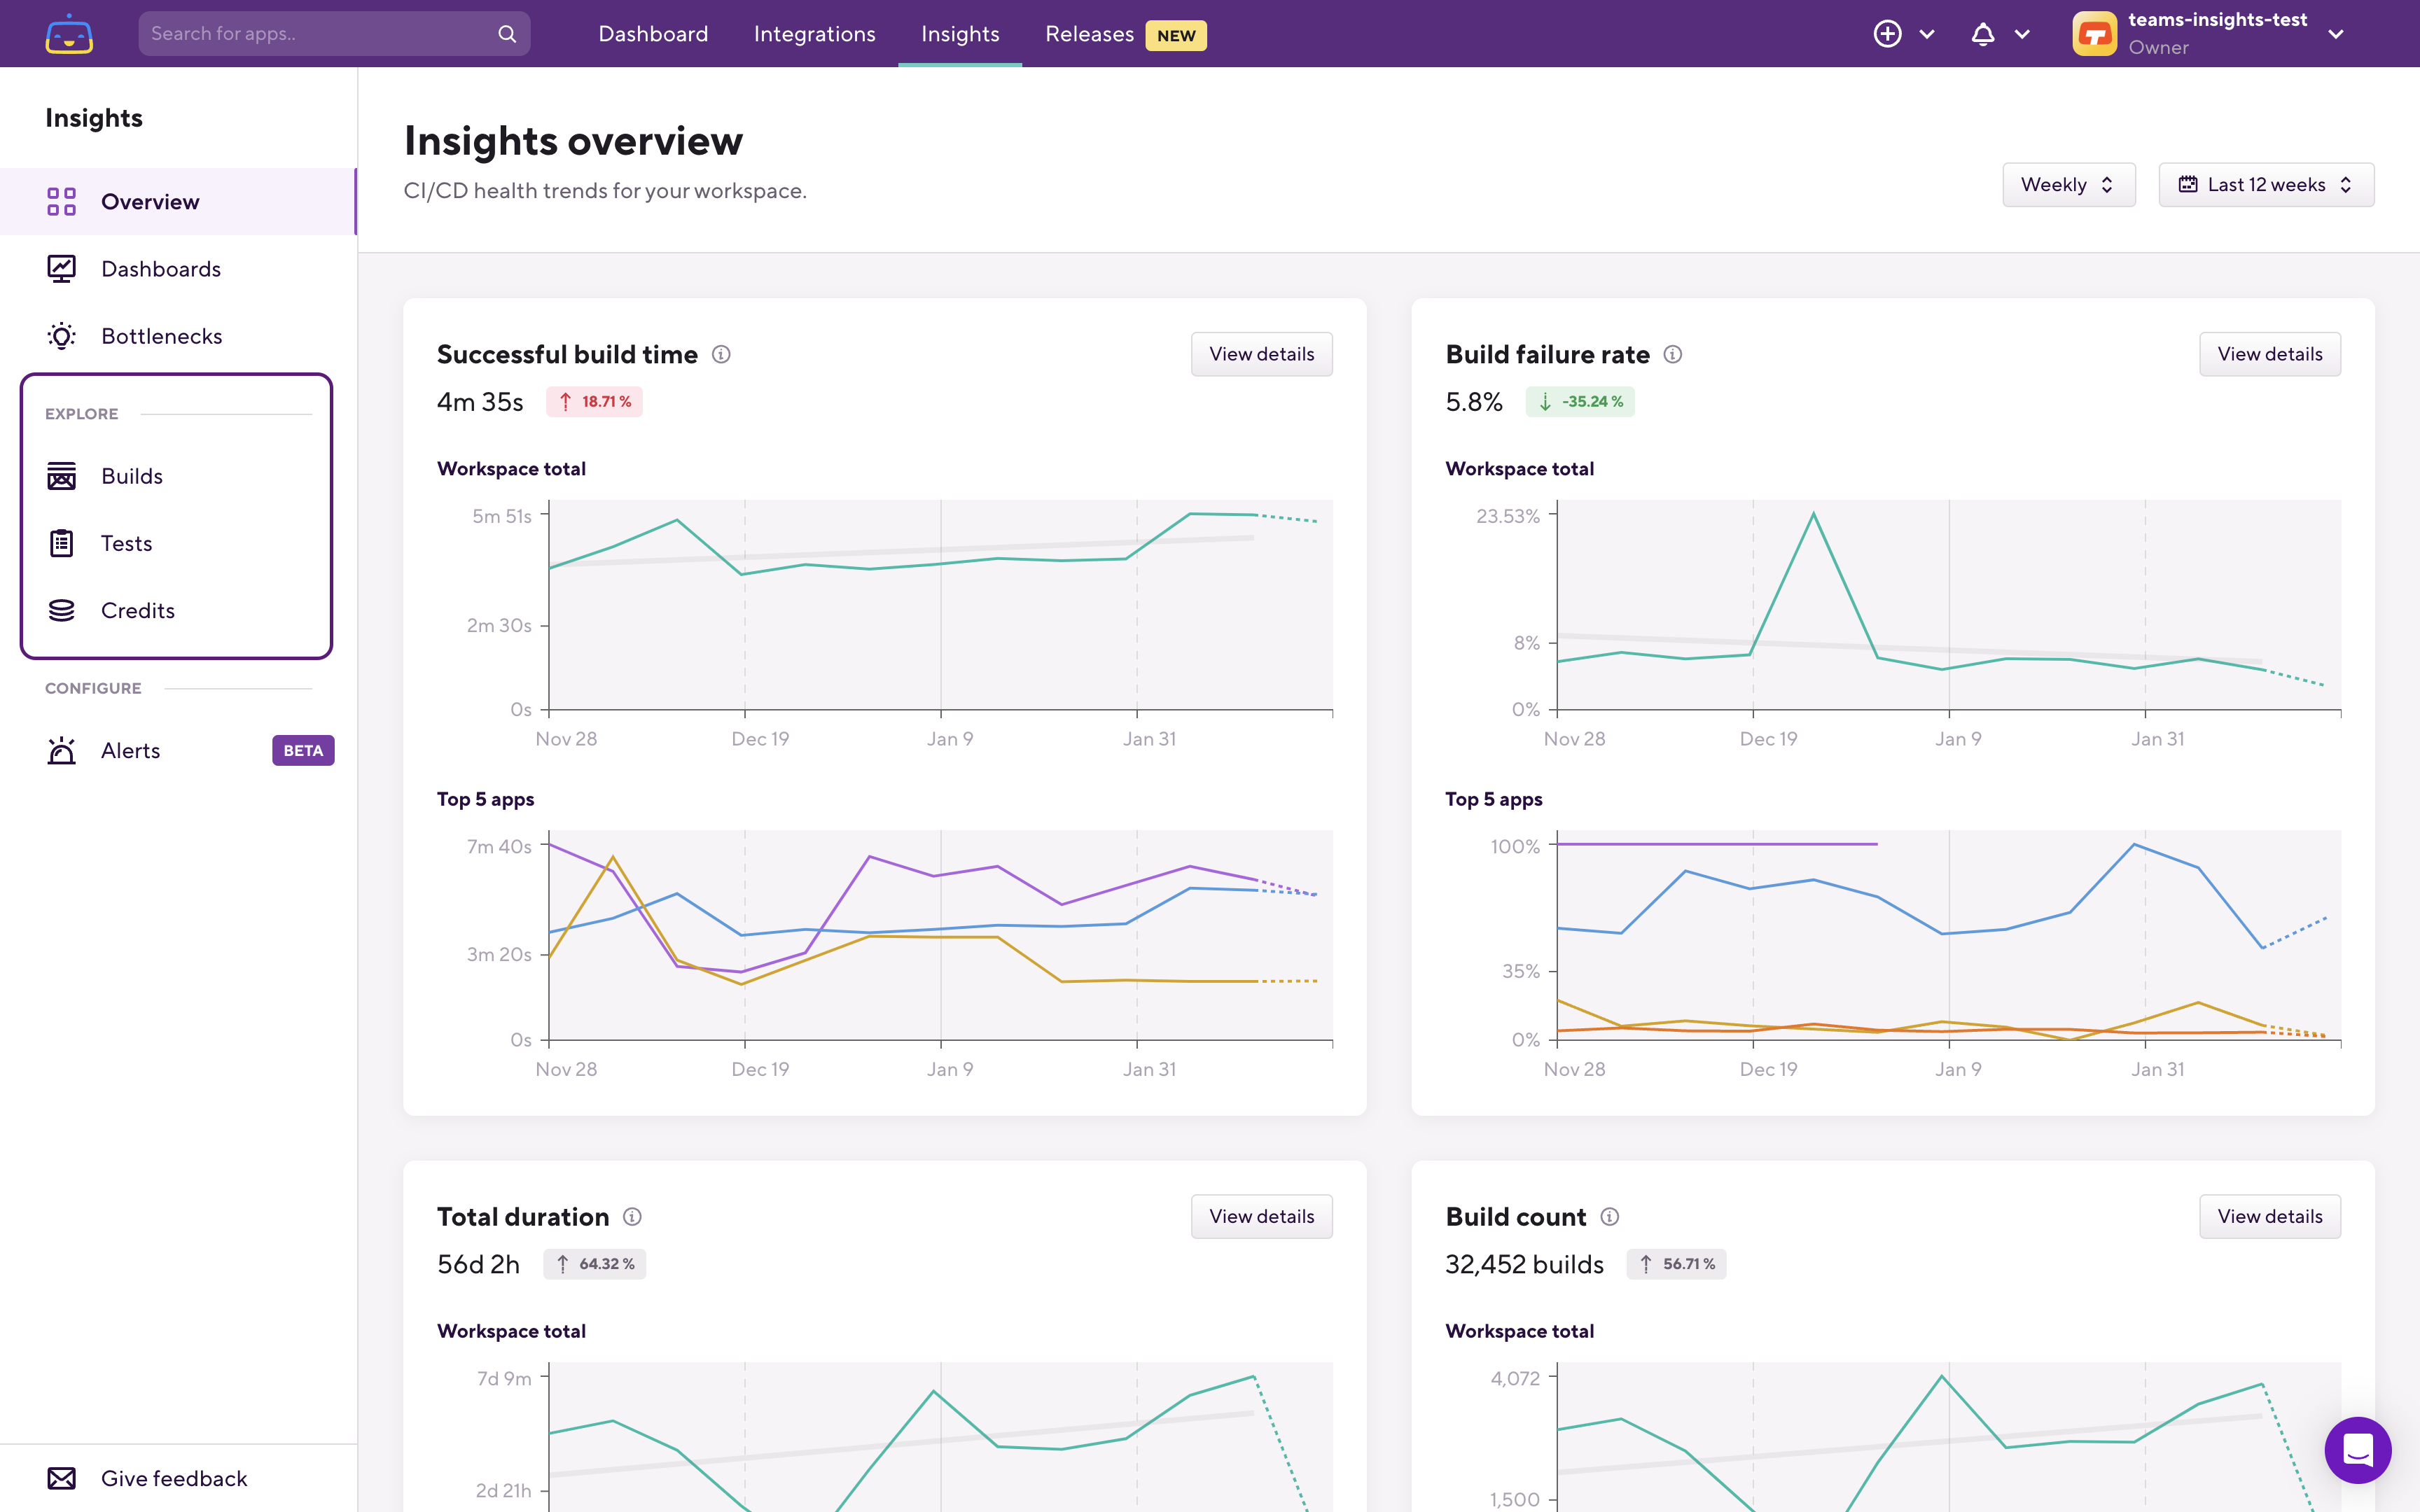
Open Bitrise Insights. On the overview page, you can create alerts in two different ways.
One is to go to the Alerts page, which you can find on the left sidebar:

The other is to start on any of the Explore pages (Builds, Tests, Credits) and create alerts from there:
Let’s go through an example starting on the Builds Explore page.
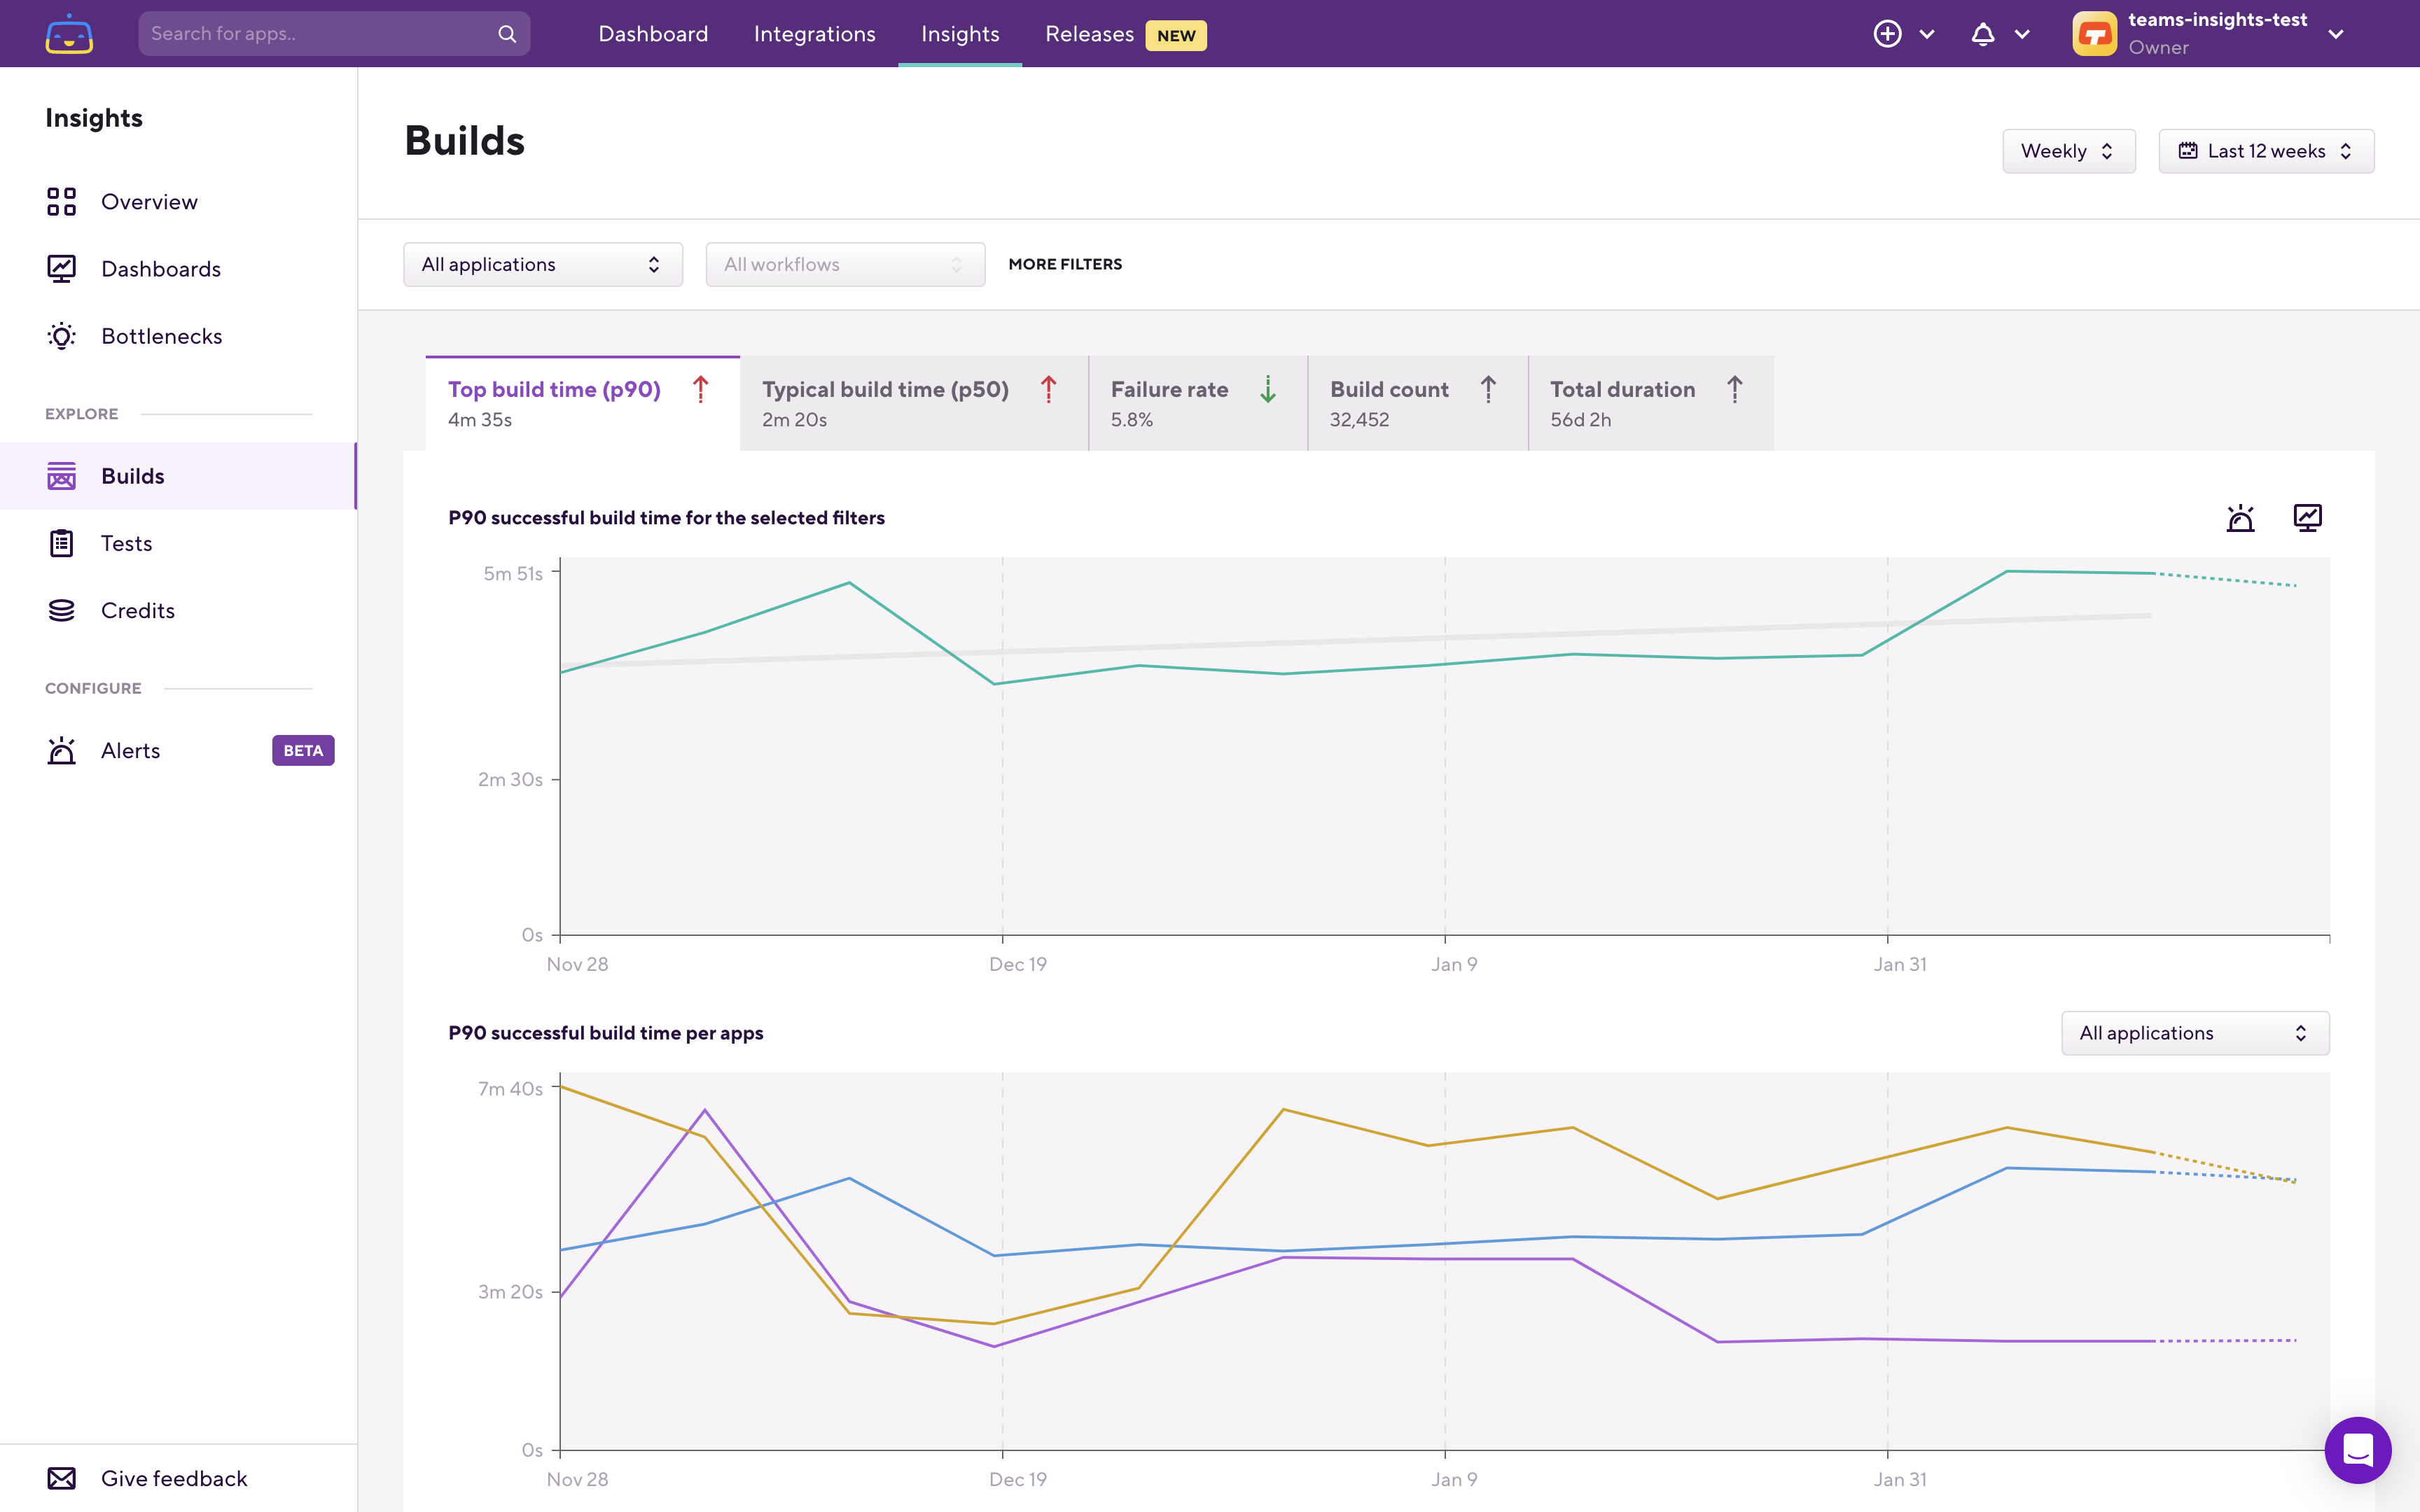
To create an alert, use the Explore pages like you would use them usually. Let’s say we want to filter down to a specific application, and then also filter down to a Workflow:

From this page, we know that this example workflow’s p90 (90th percentile) successful build time is around the 8-minute mark. As this is an important workflow in our pull request process, we want to ensure that it remains under 8 minutes. So let’s create an alert to get notified if it would go over 8 minutes.
To do that you can use the Create alert button on the right side above the chart.

When you use the Create alert button on the Explore pages, you’ll get to the Create Alert page where all the relevant filters will be set based on which filters you had on the Explore page.
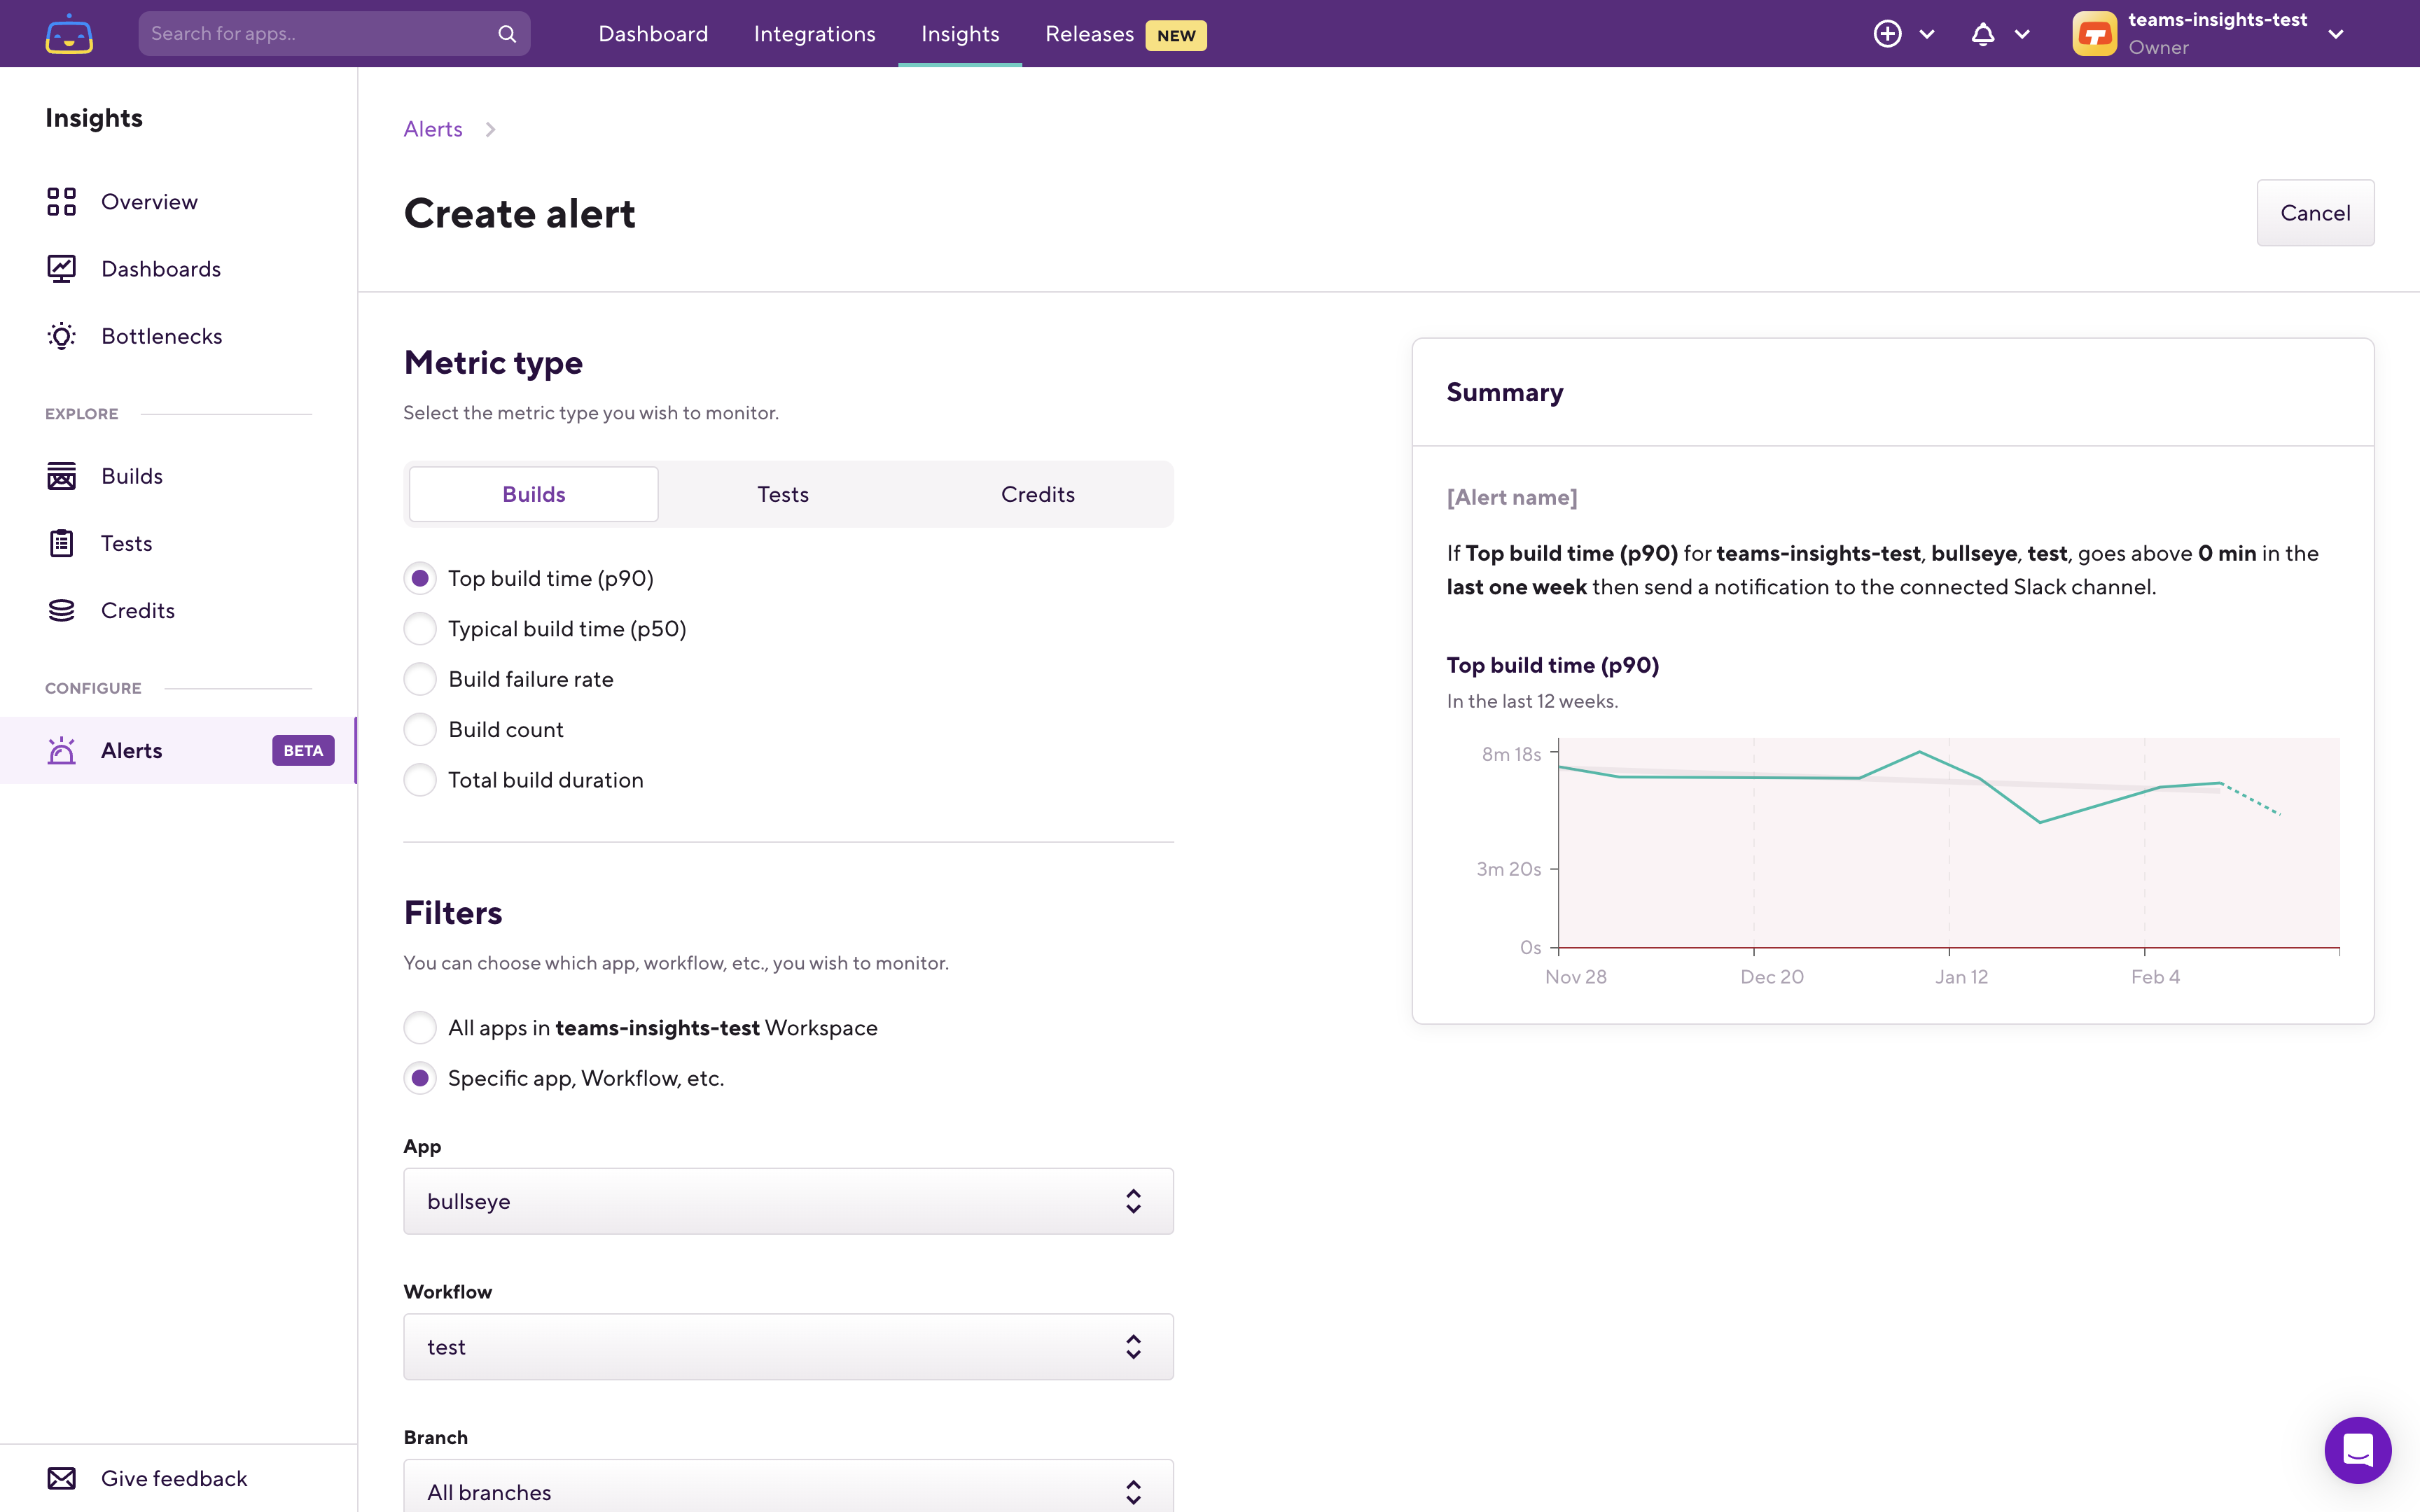
In this specific example, we were checking the workflow’s top build time — the 90th percentile, so that’s automatically selected, along with the bullseye application and the workflow called test as these were the variables we were investigating. On the right side, you can see a preview of the alert.
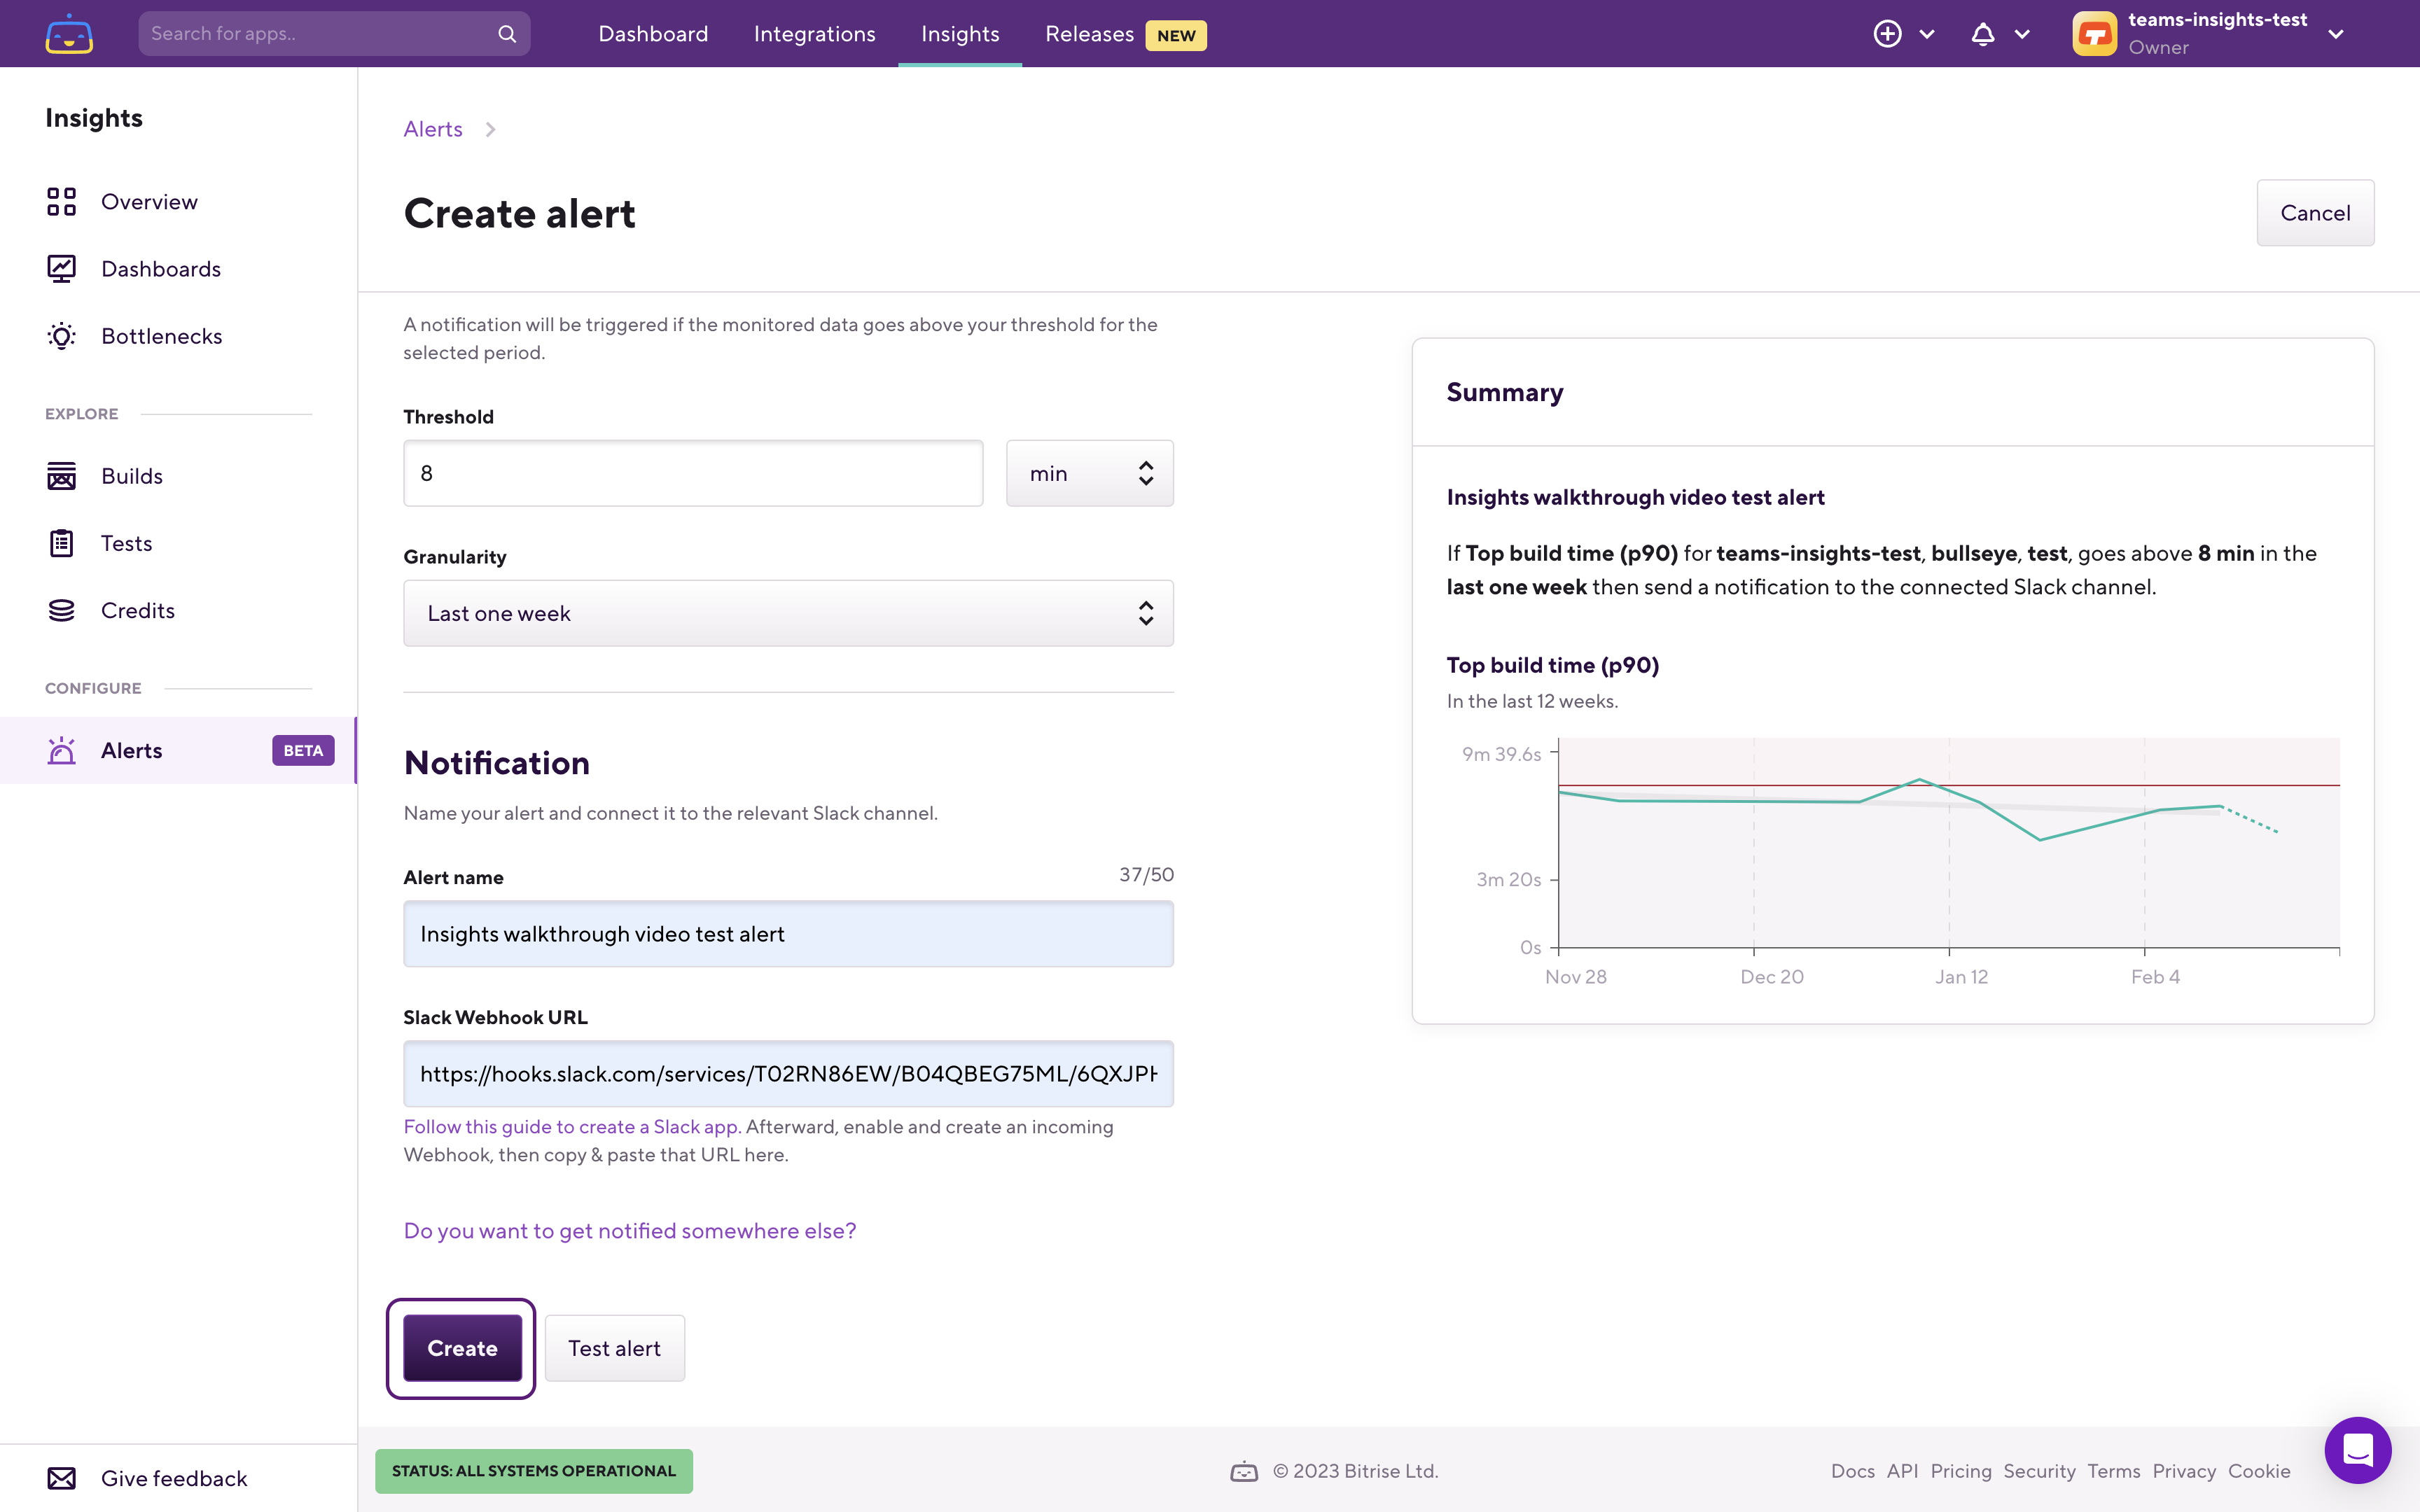
The next section is where you can set the threshold. As we want to get notified when the p90 (90th percentile) successful build time of this workflow would go over 8 minutes, we can set the 8 minutes threshold here:

As you can see on the right side the summary view got updated and it shows you the recent history of this metric and also the threshold that you configured. Looking at the summary, you can see how frequently you were over the threshold and how you are trending against that threshold. Now we have both the metric on which we want to alert on, and also the threshold to alert against.
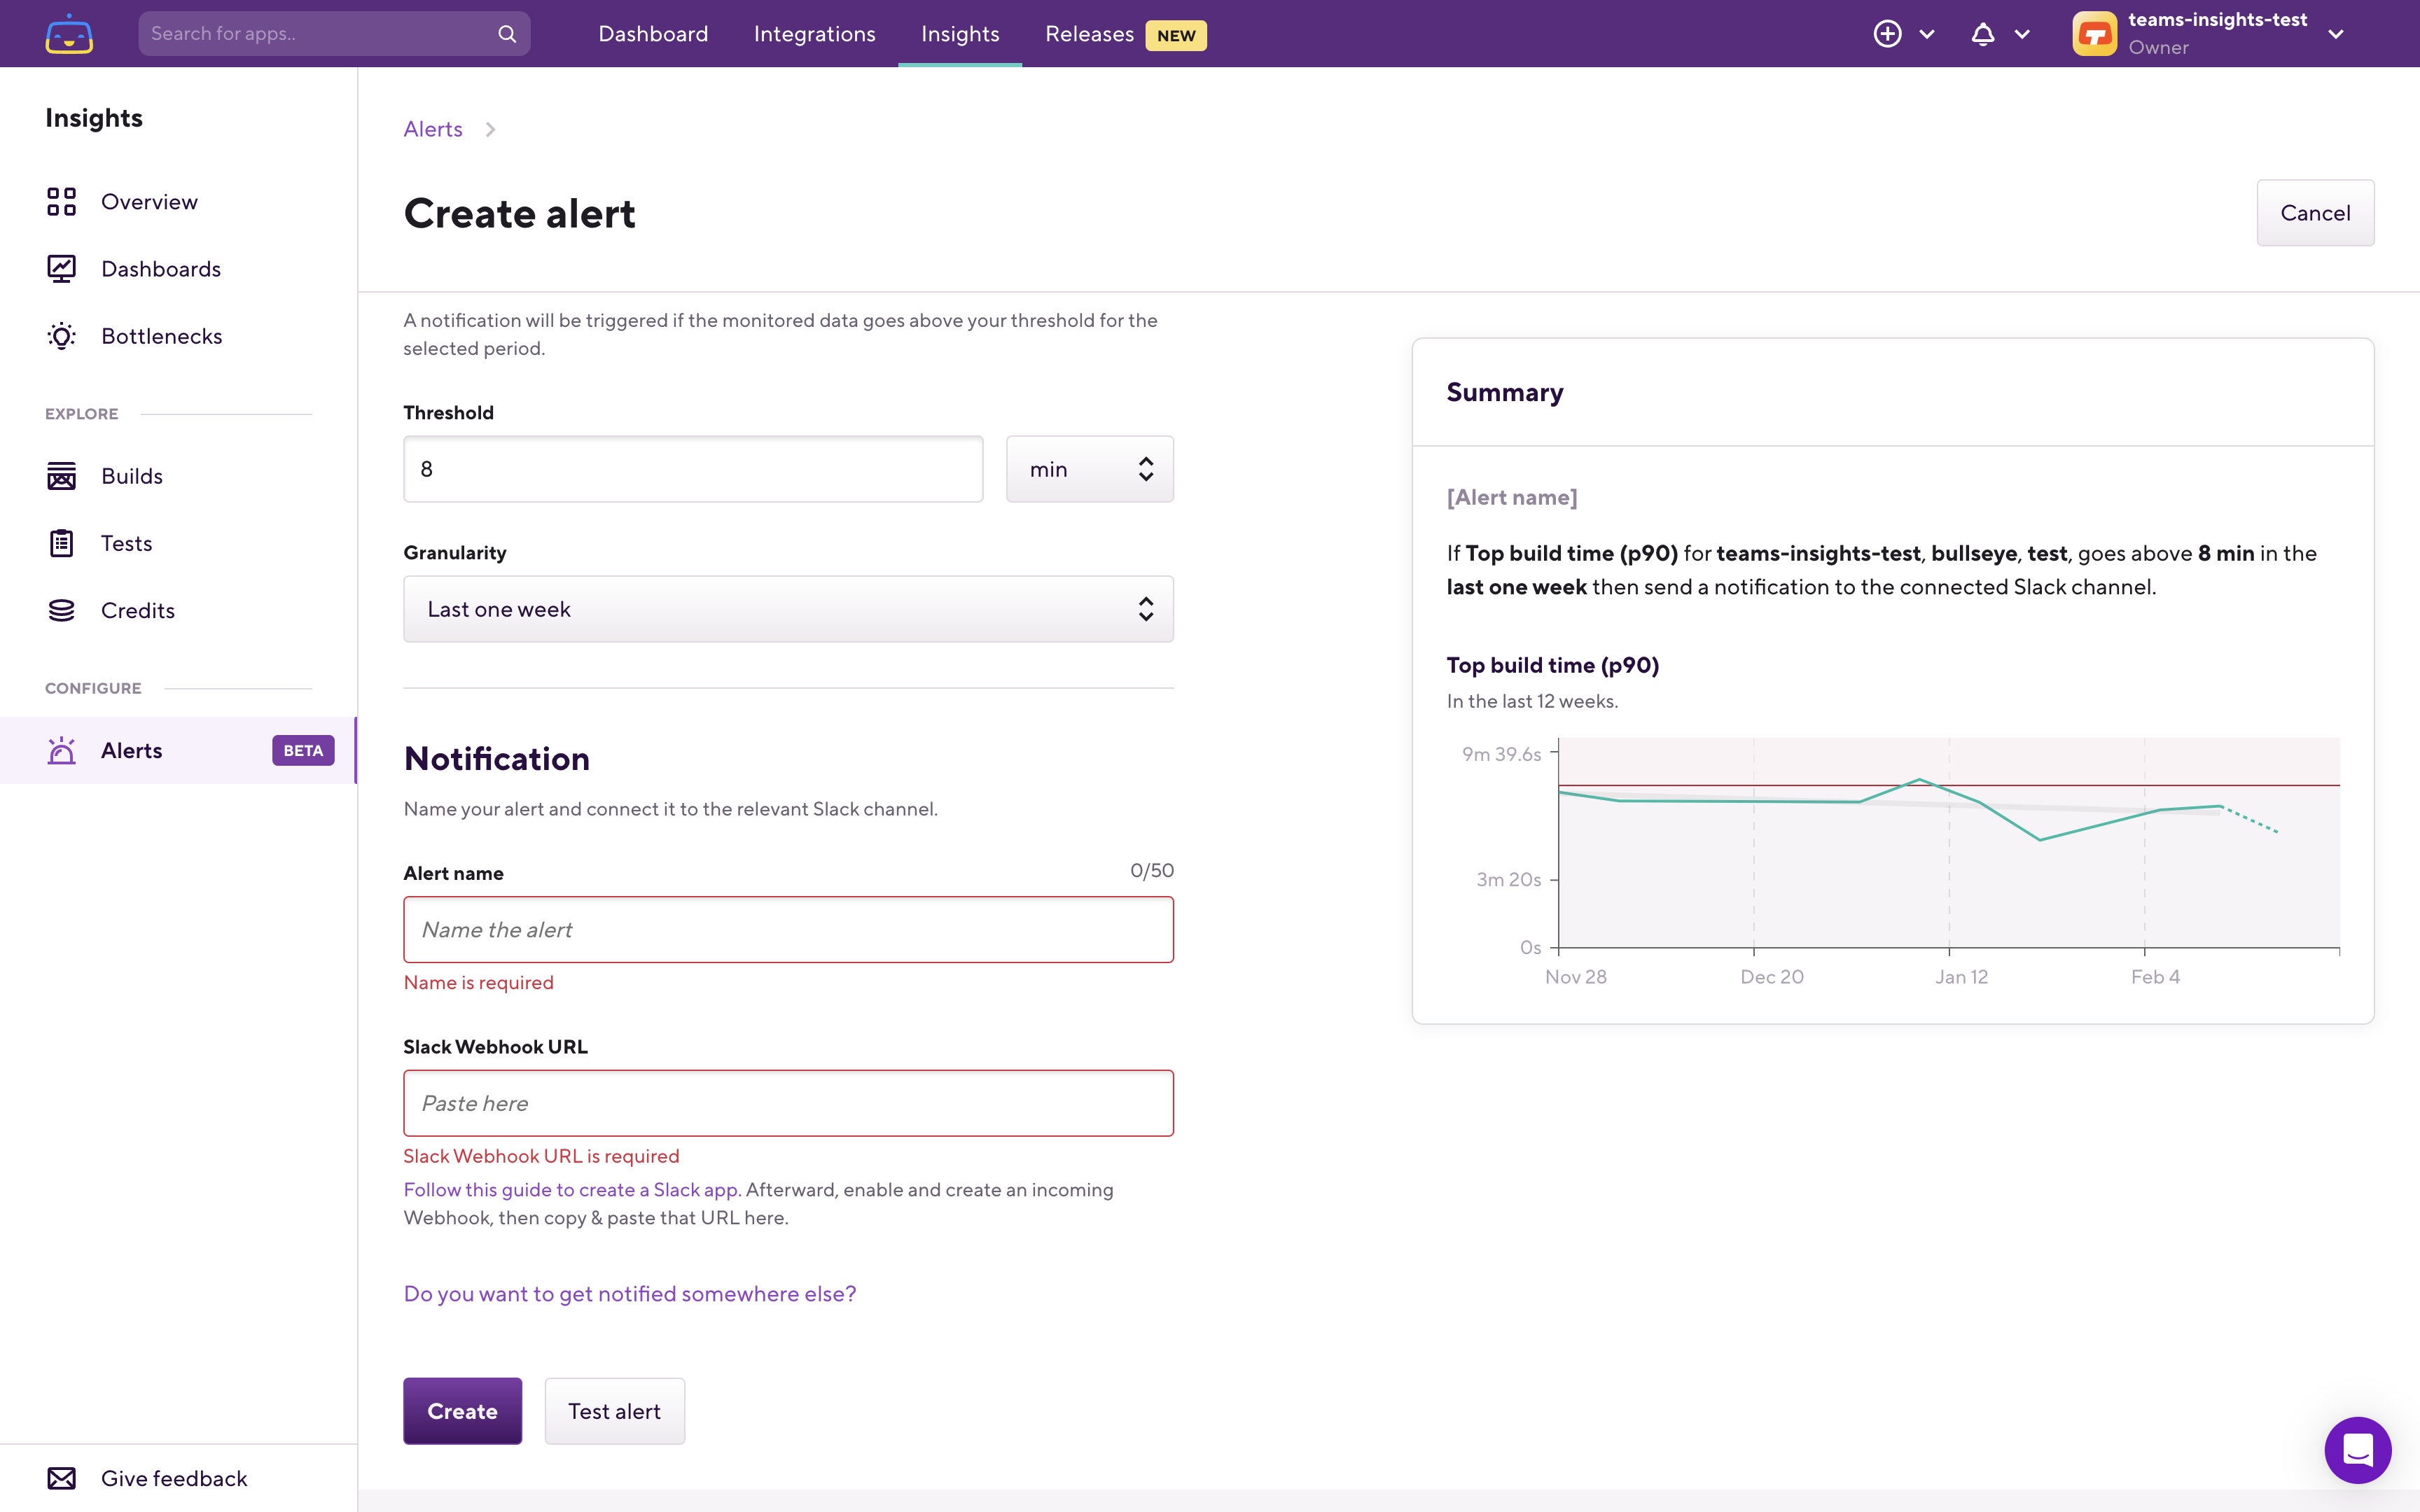
Also important is to name our alert so that we can find it later in our alerts list. The last thing left to do is to configure where the alert should be delivered.
Configuring where the alert should be delivered
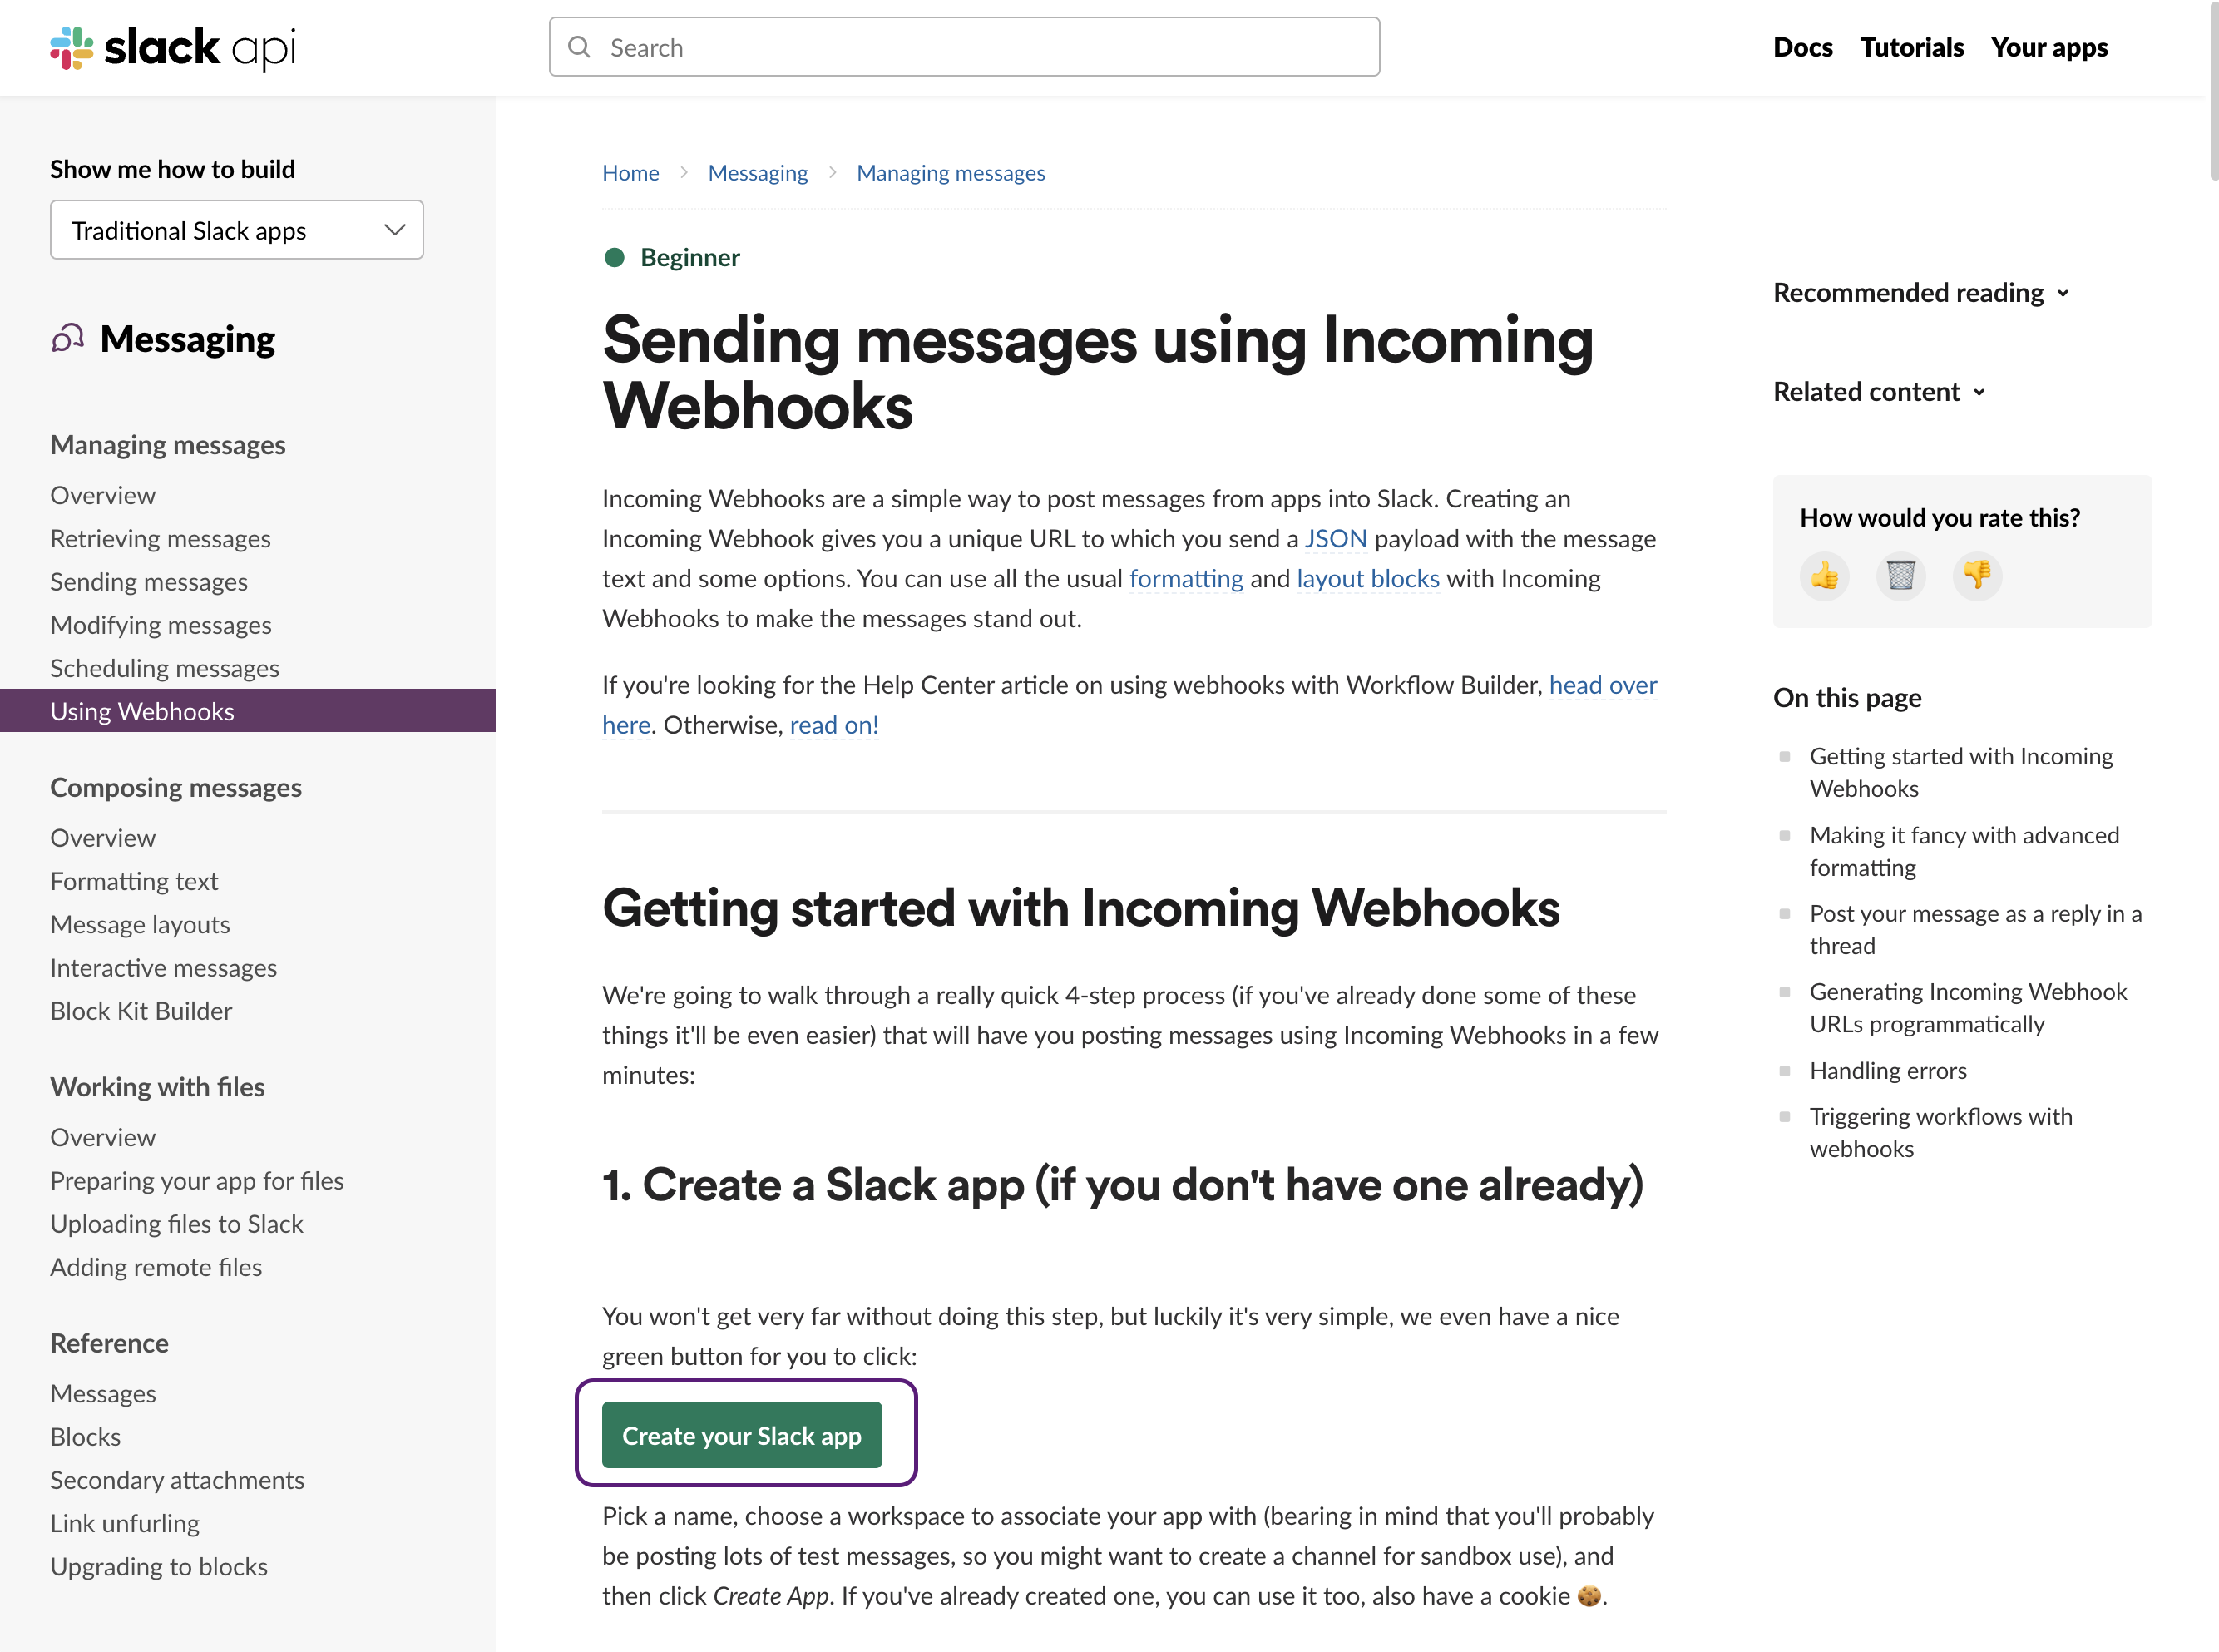
The default alert delivery destination is Slack, using Slack Webhooks. You can find a guide under the Slack Webhook URL field, which will guide you through how you can very quickly create a Slack app and generate a webhook URL.
Creating a Slack webhook app is really simple. First, you have to create a Slack app. For that, you can use the button which is included in the official guide.
The next step is to choose how we want to configure the app. As this will be a super simple one we can use the From scratch option:
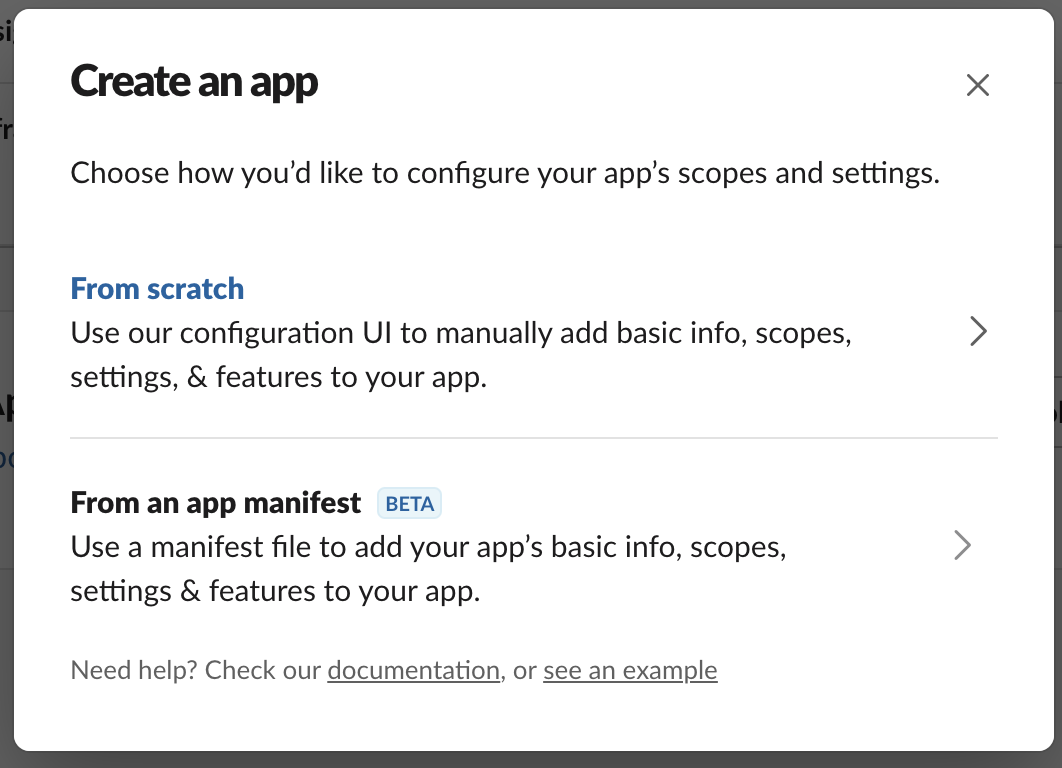
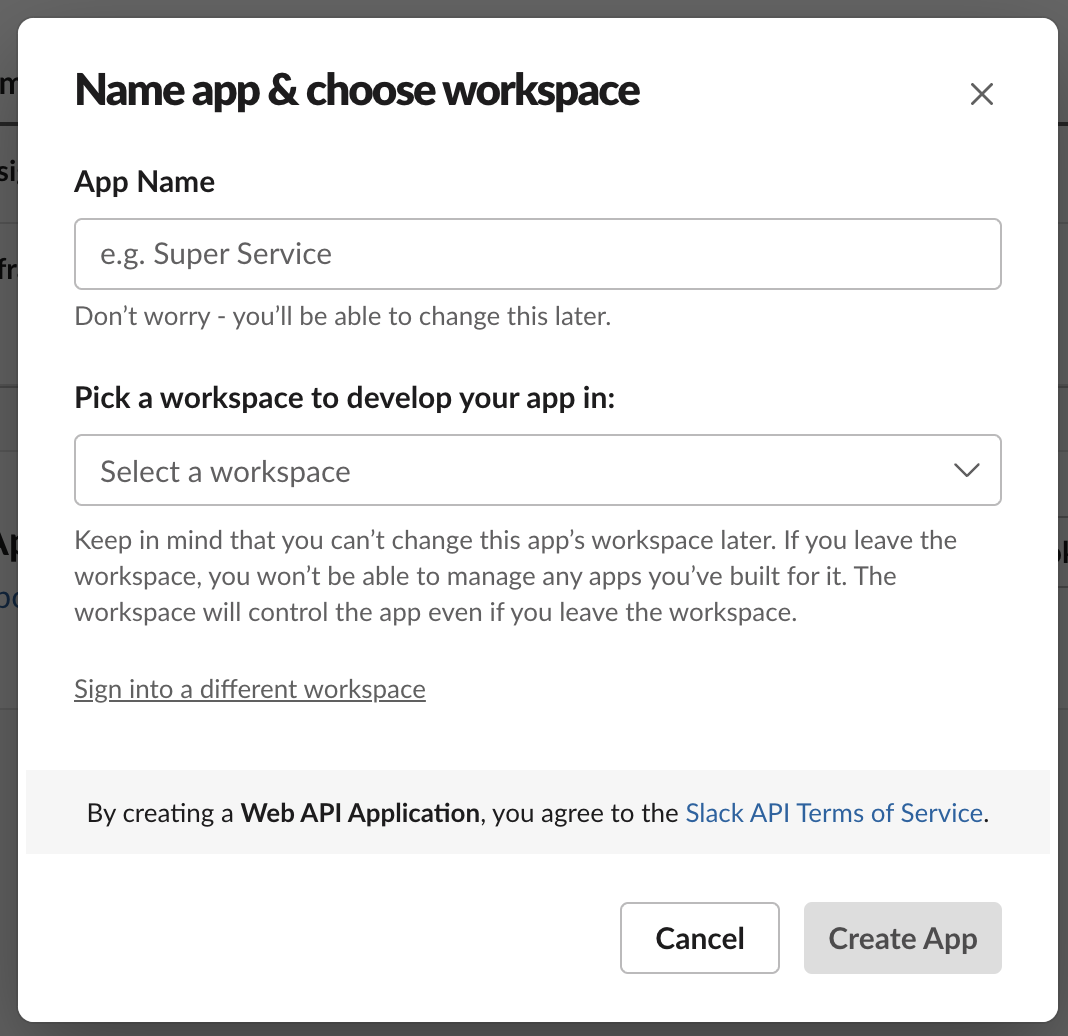
With this option we just have to specify a name for the Slack app, and choose the Slack workspace where we want to receive the Slack notifications.
The next step is to select the type of App that we want to create. Here we just want to go with a very simple Incoming Webhooks app.
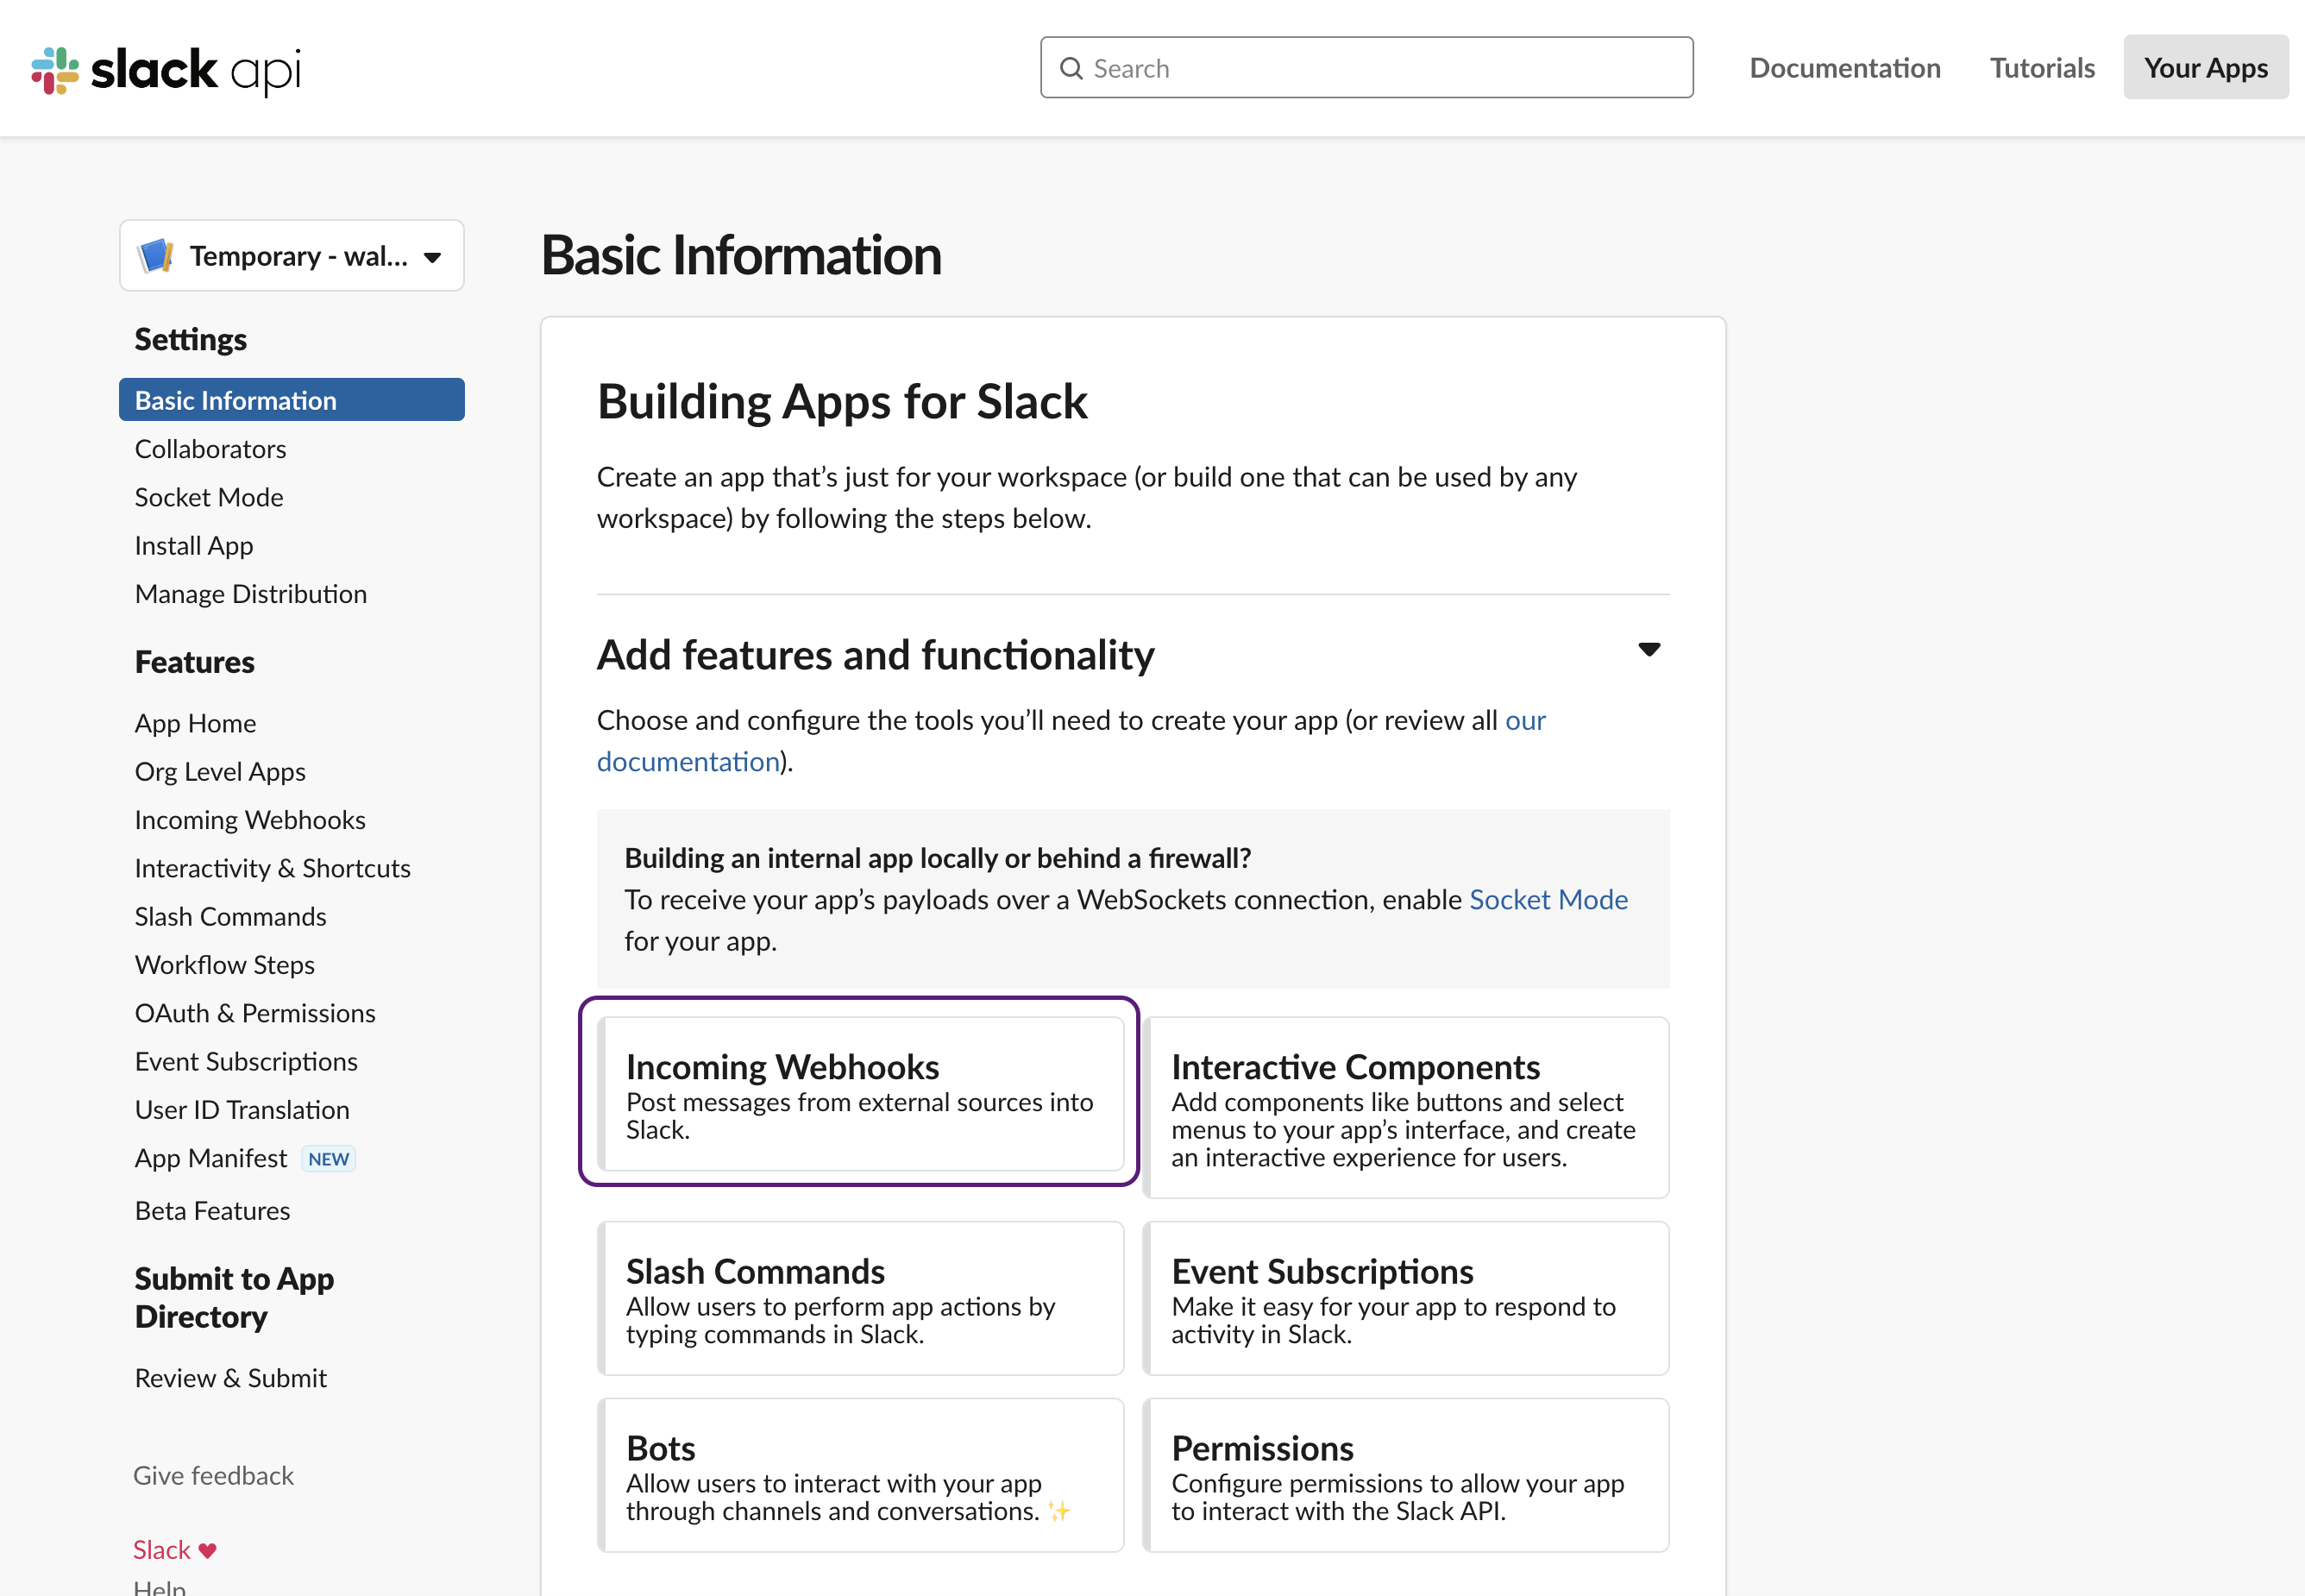
On the next page activate Incoming Webhooks if it’s not enabled yet.

Now go to the bottom of the page and create a Webhook URL:
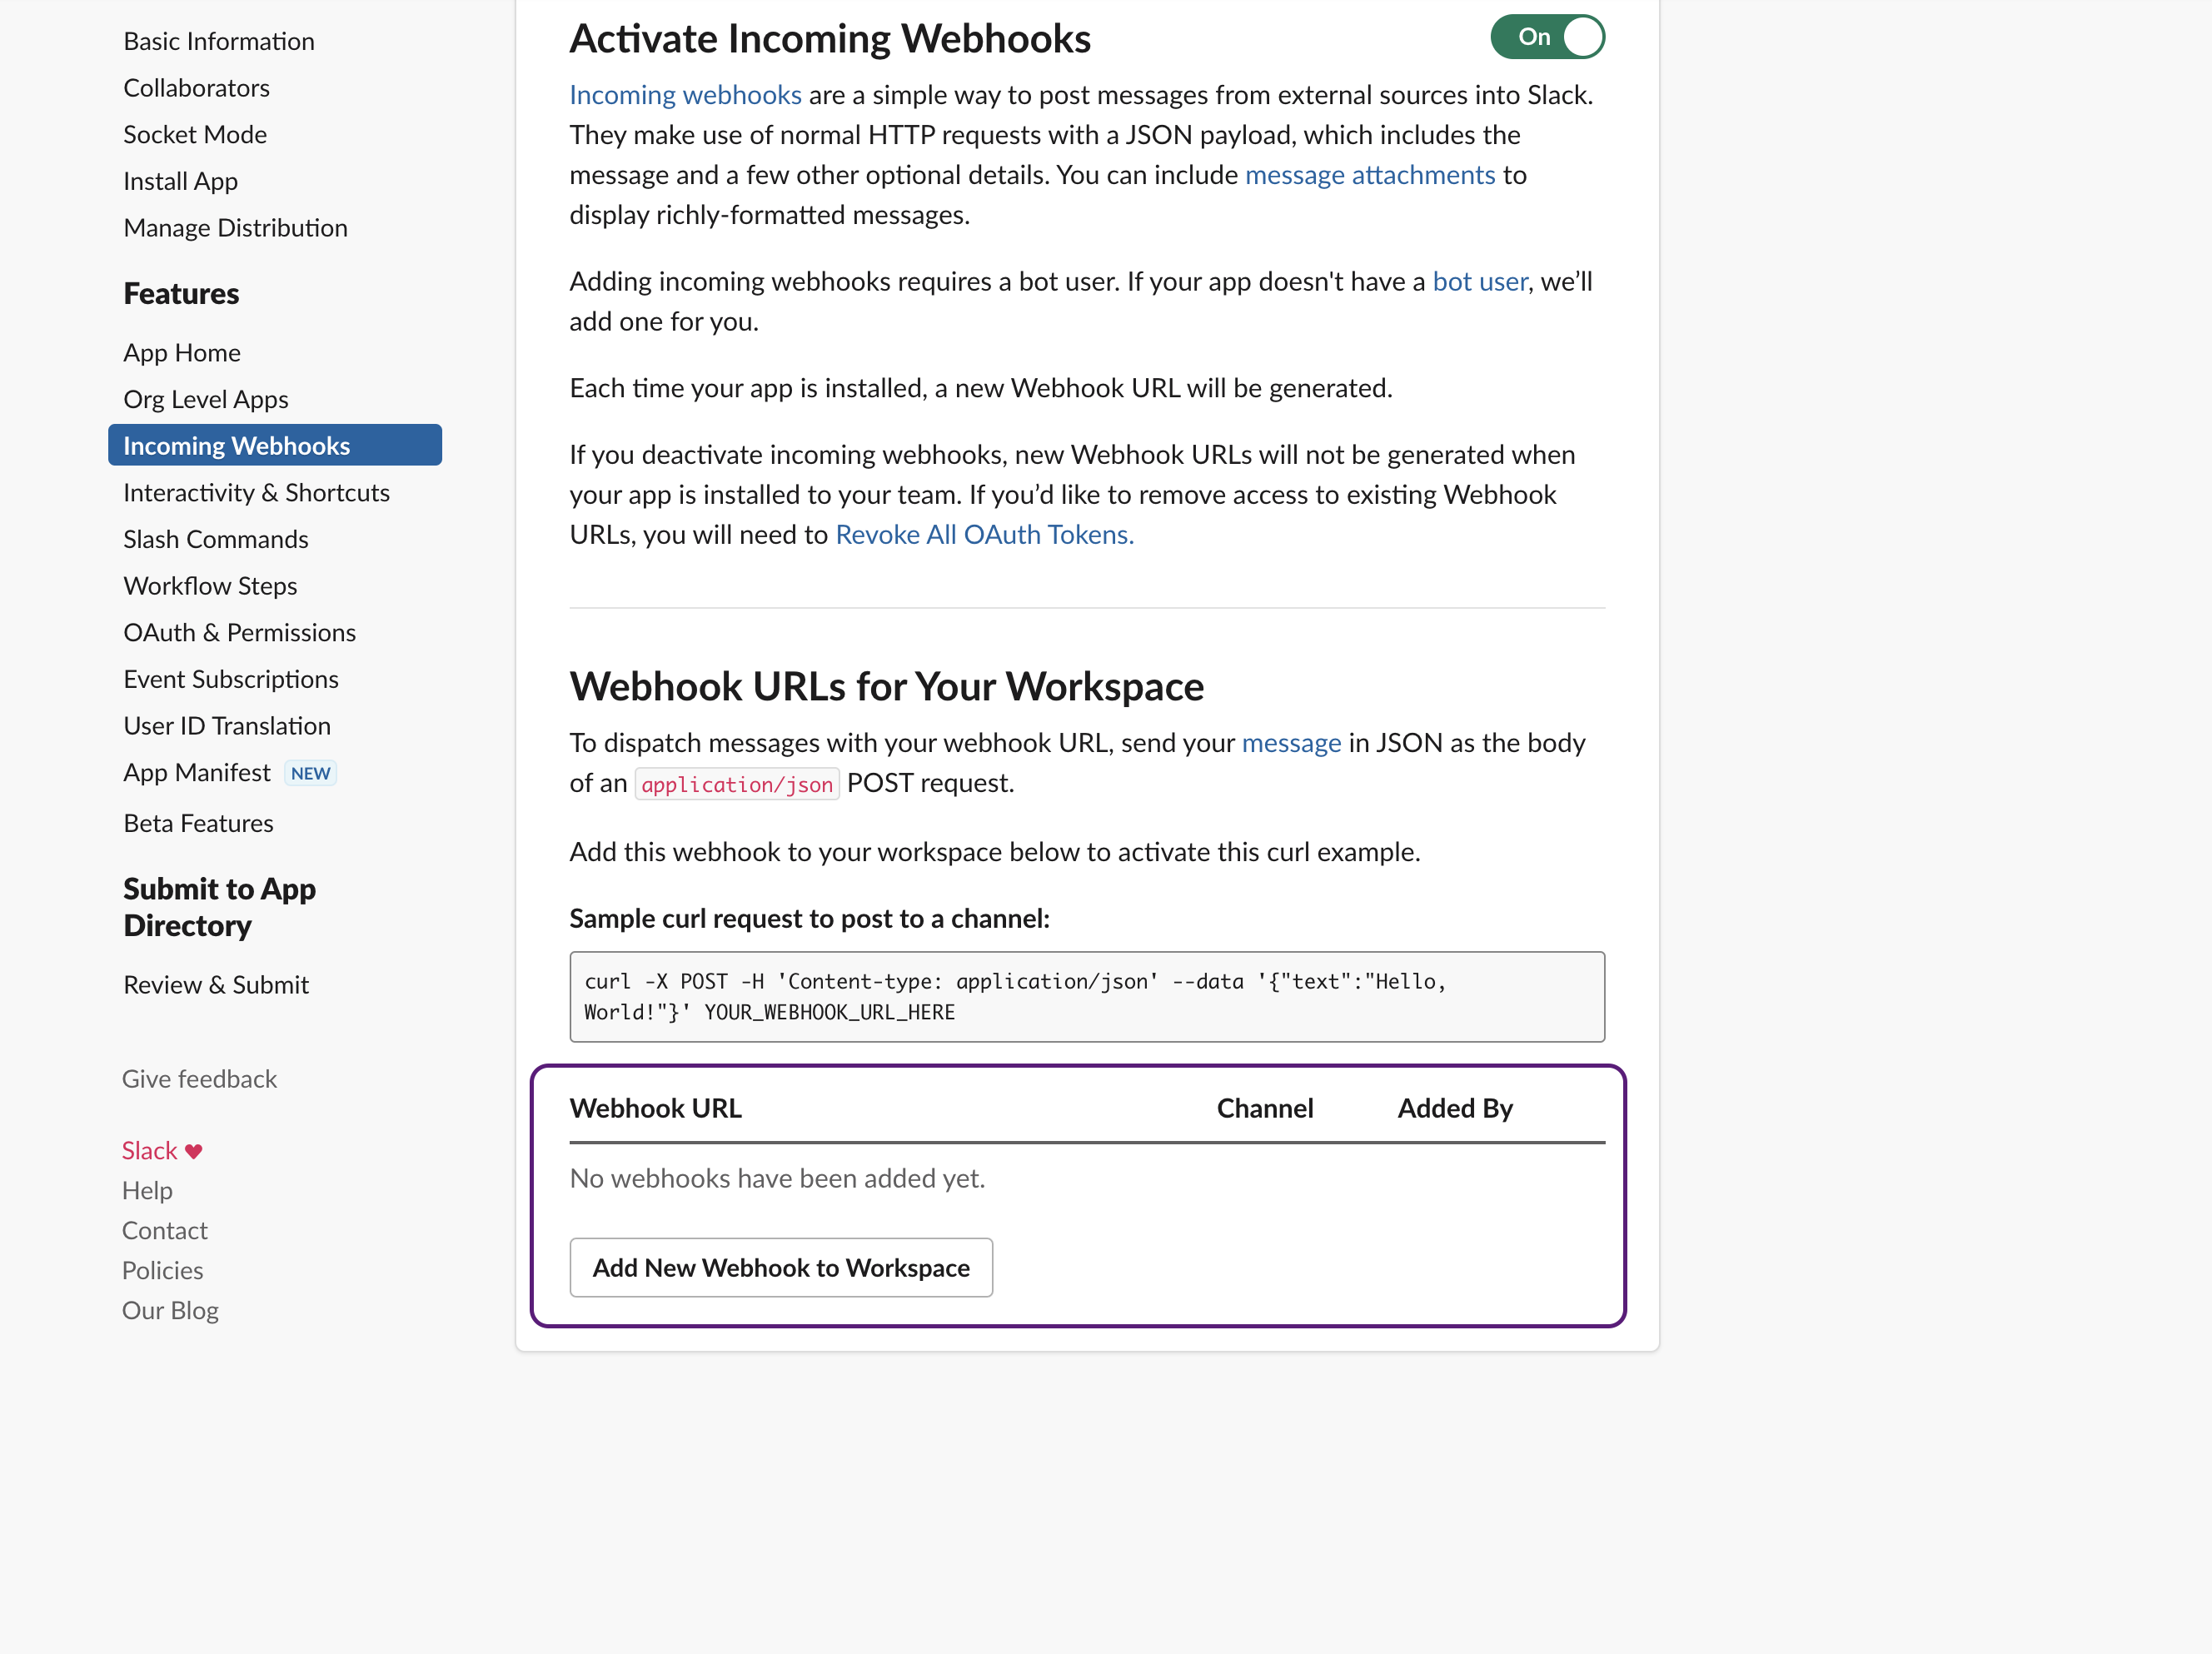
Clicking the Add New Webhook to Workspace button you will have to select which Slack channel you want to receive the messages in.
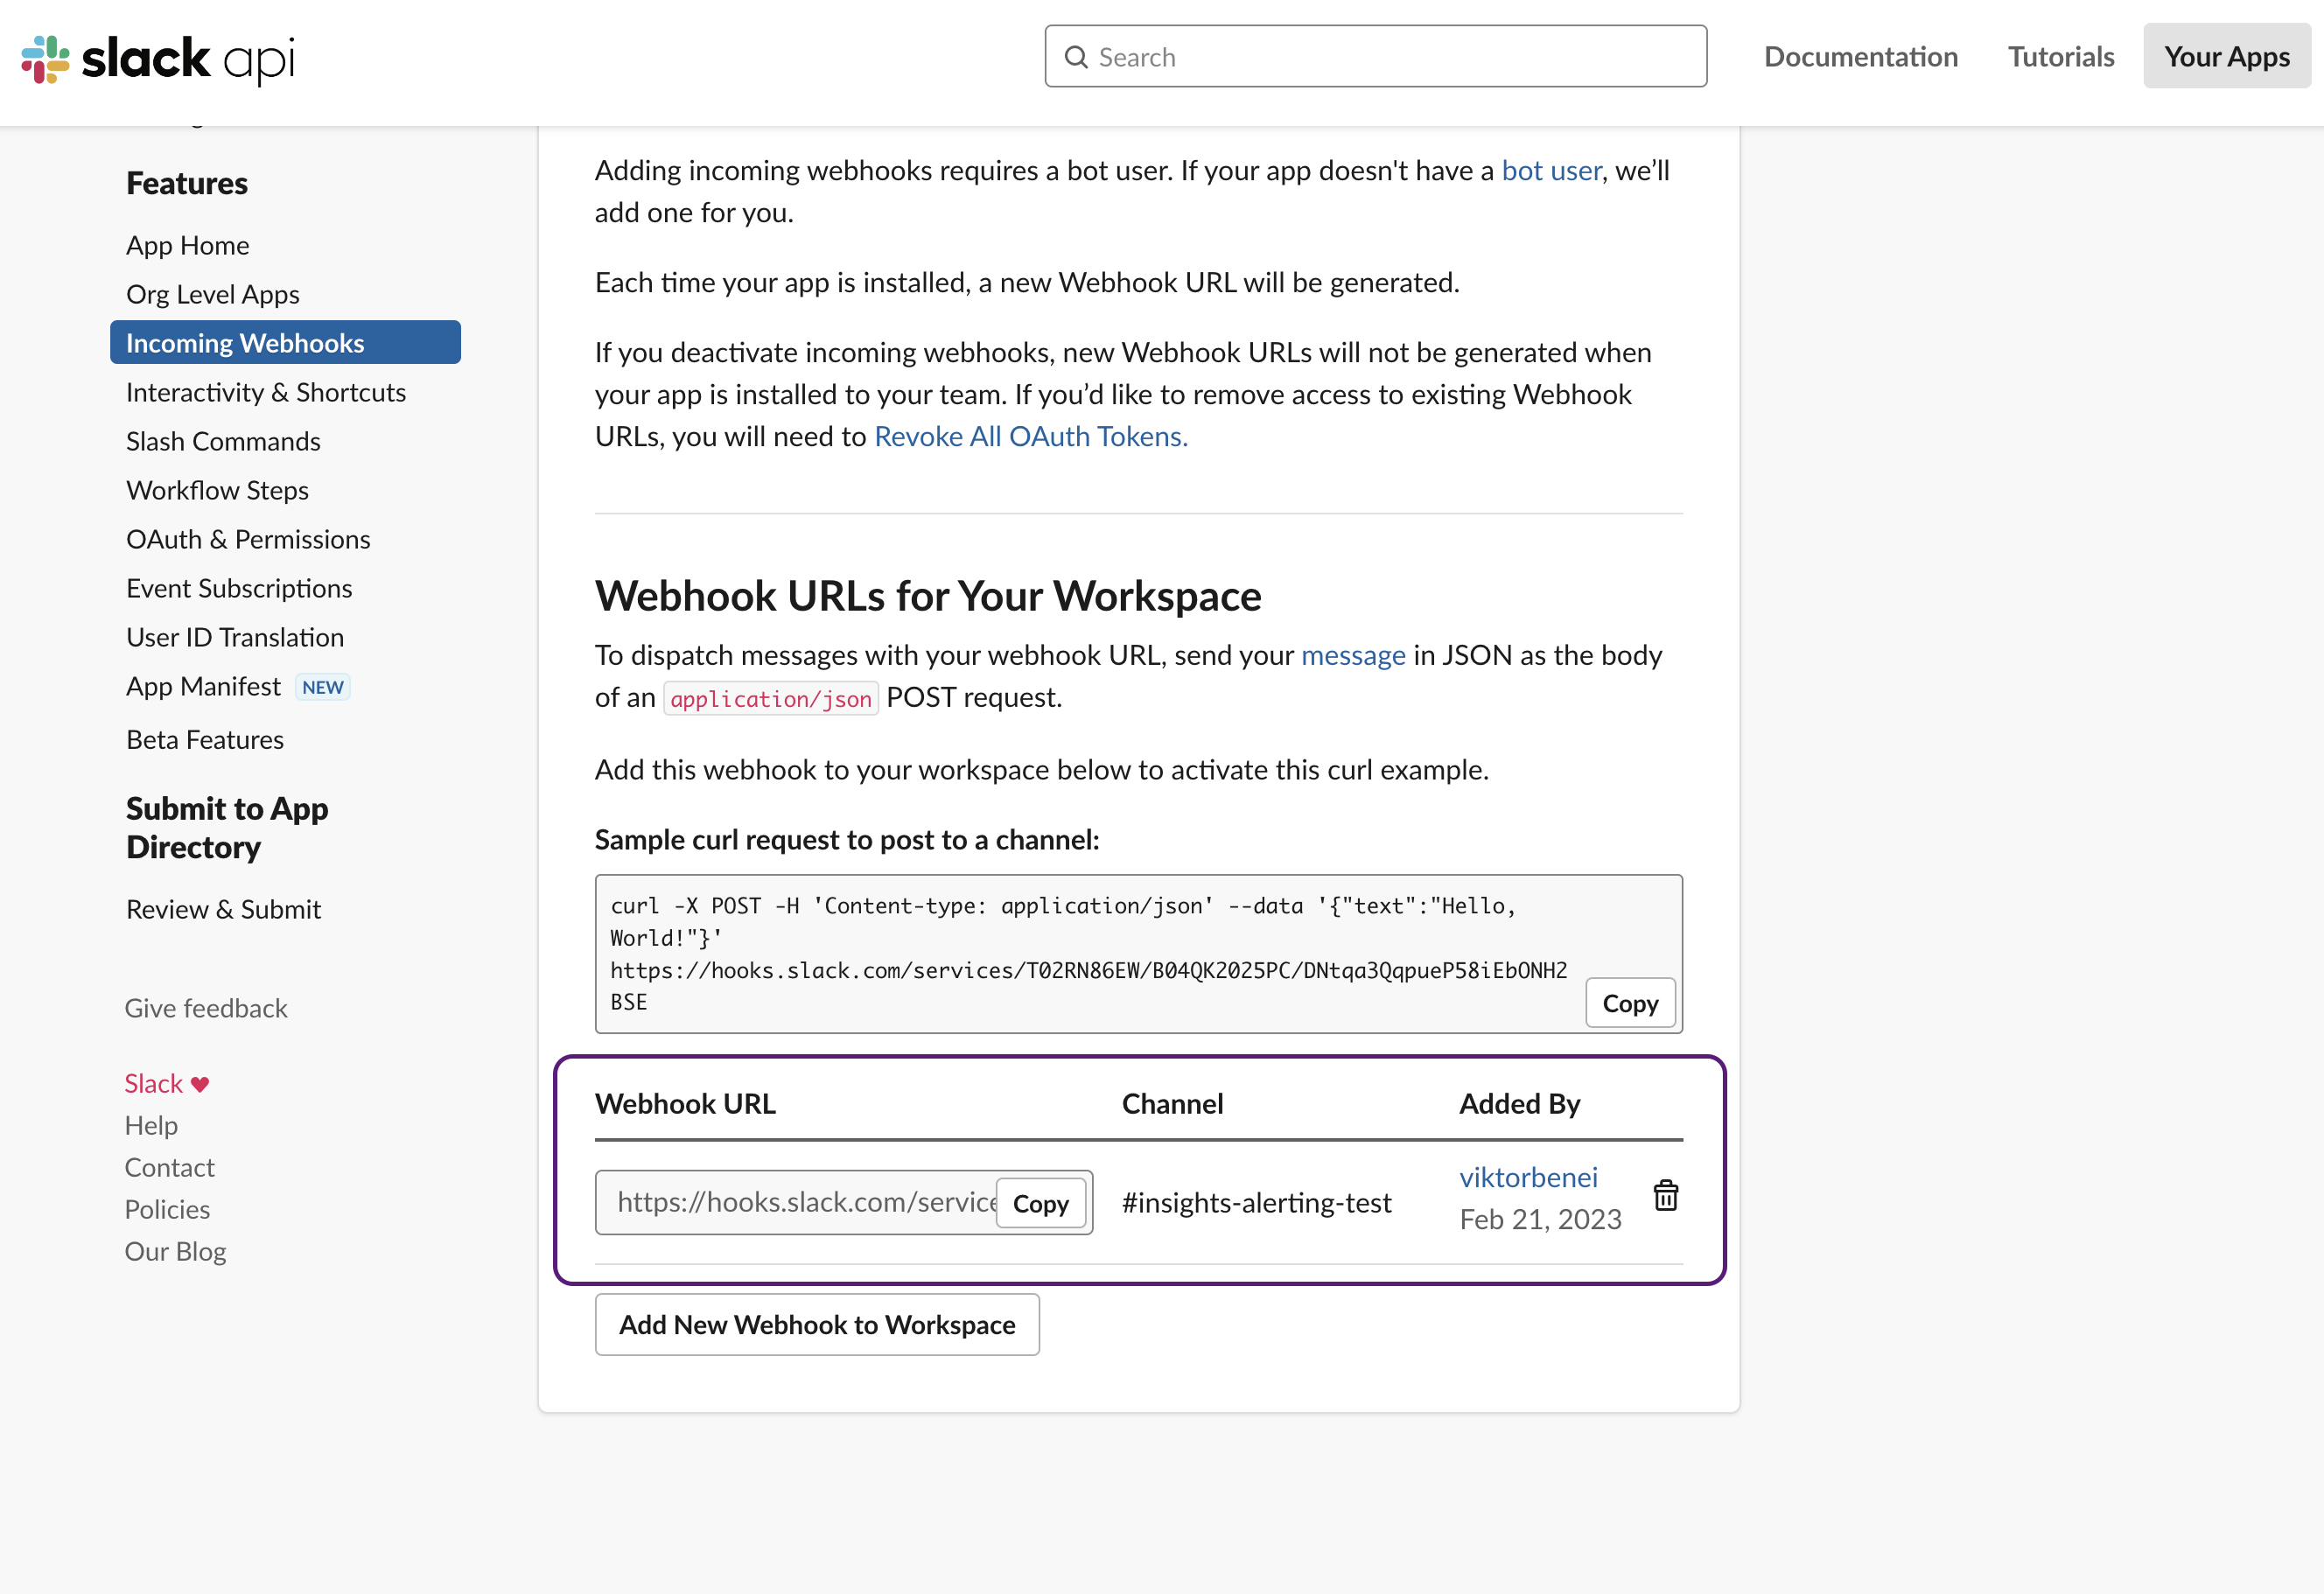
That’s it! We now have the application and the webhook configured.
Note: you can re-use the same Slack app and even the same Webhook URL across different Alerts, you don’t have to create a new app and new webhook URL for every alert. Different Slack apps can have different names, icons and colors, so in certain cases you might want to create a few specific ones, for example per-team.
All that’s left is to copy the webhook URL:
And paste it on Bitrise Insights:
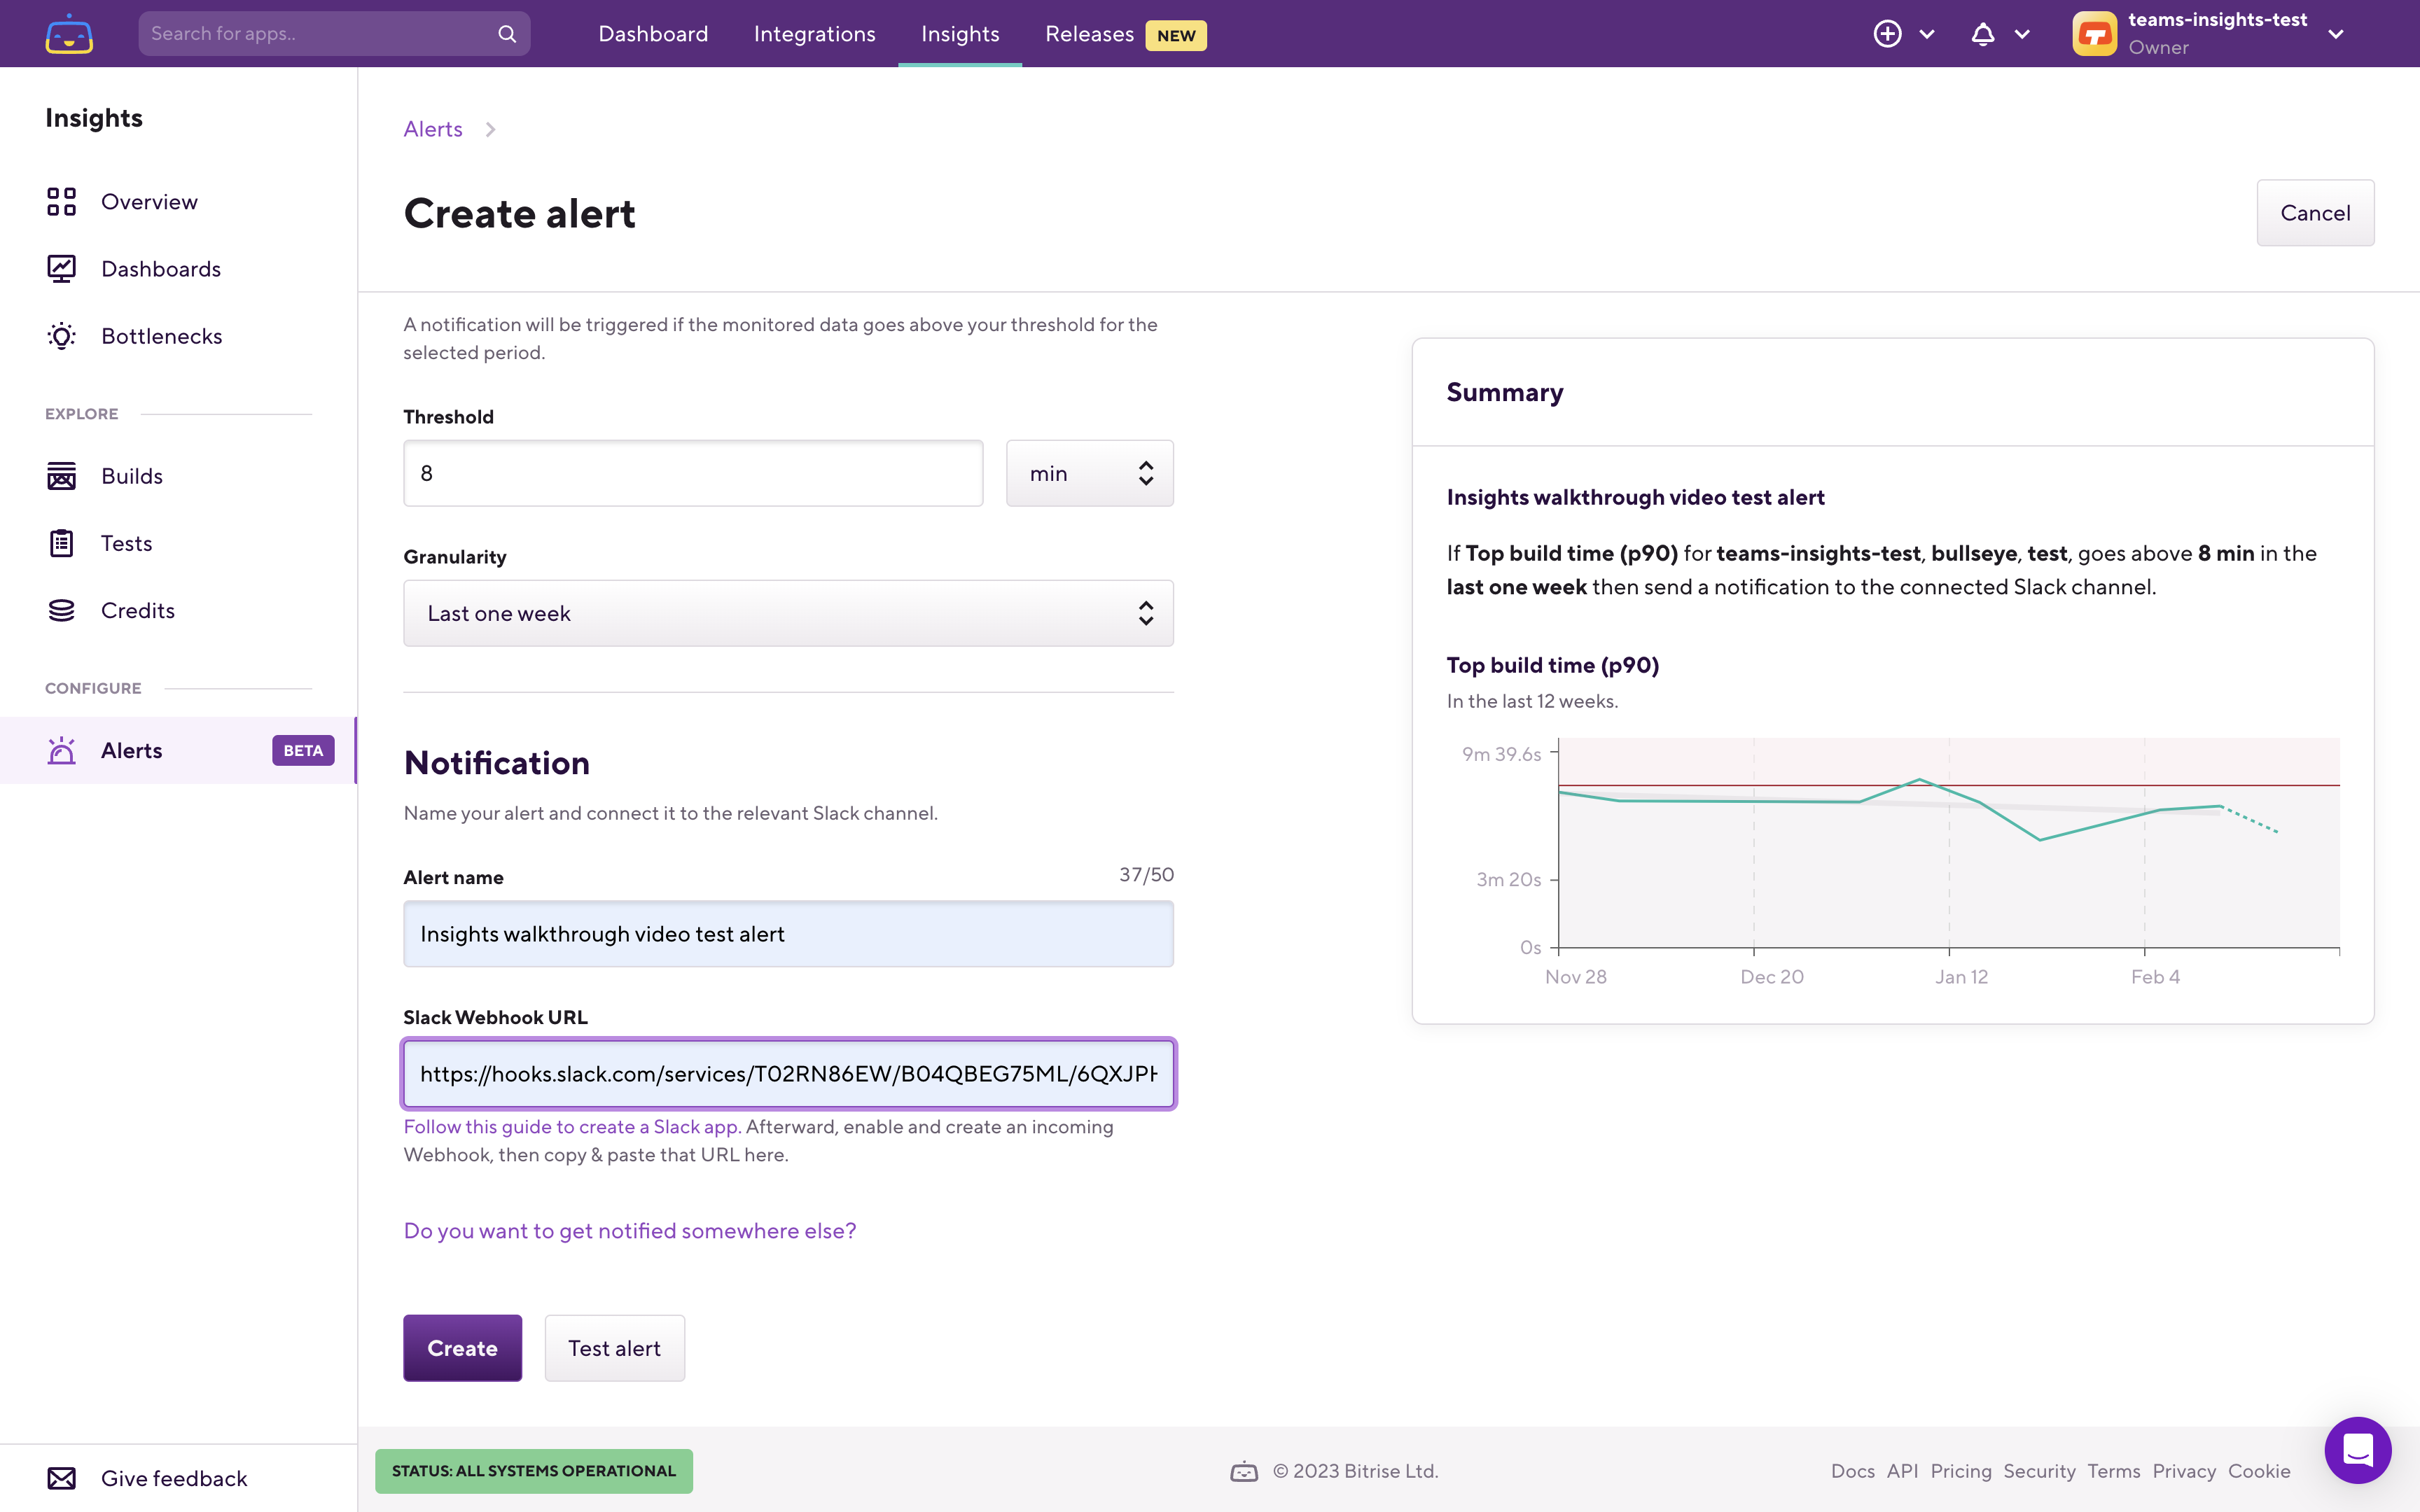
Before creating the alert you can also test it, to ensure that the message is delivered in the right Slack channel, using the Test alert button.
If everything was configured correctly this is roughly what you’ll see:
Now go ahead and create the alert by clicking on the Create button:
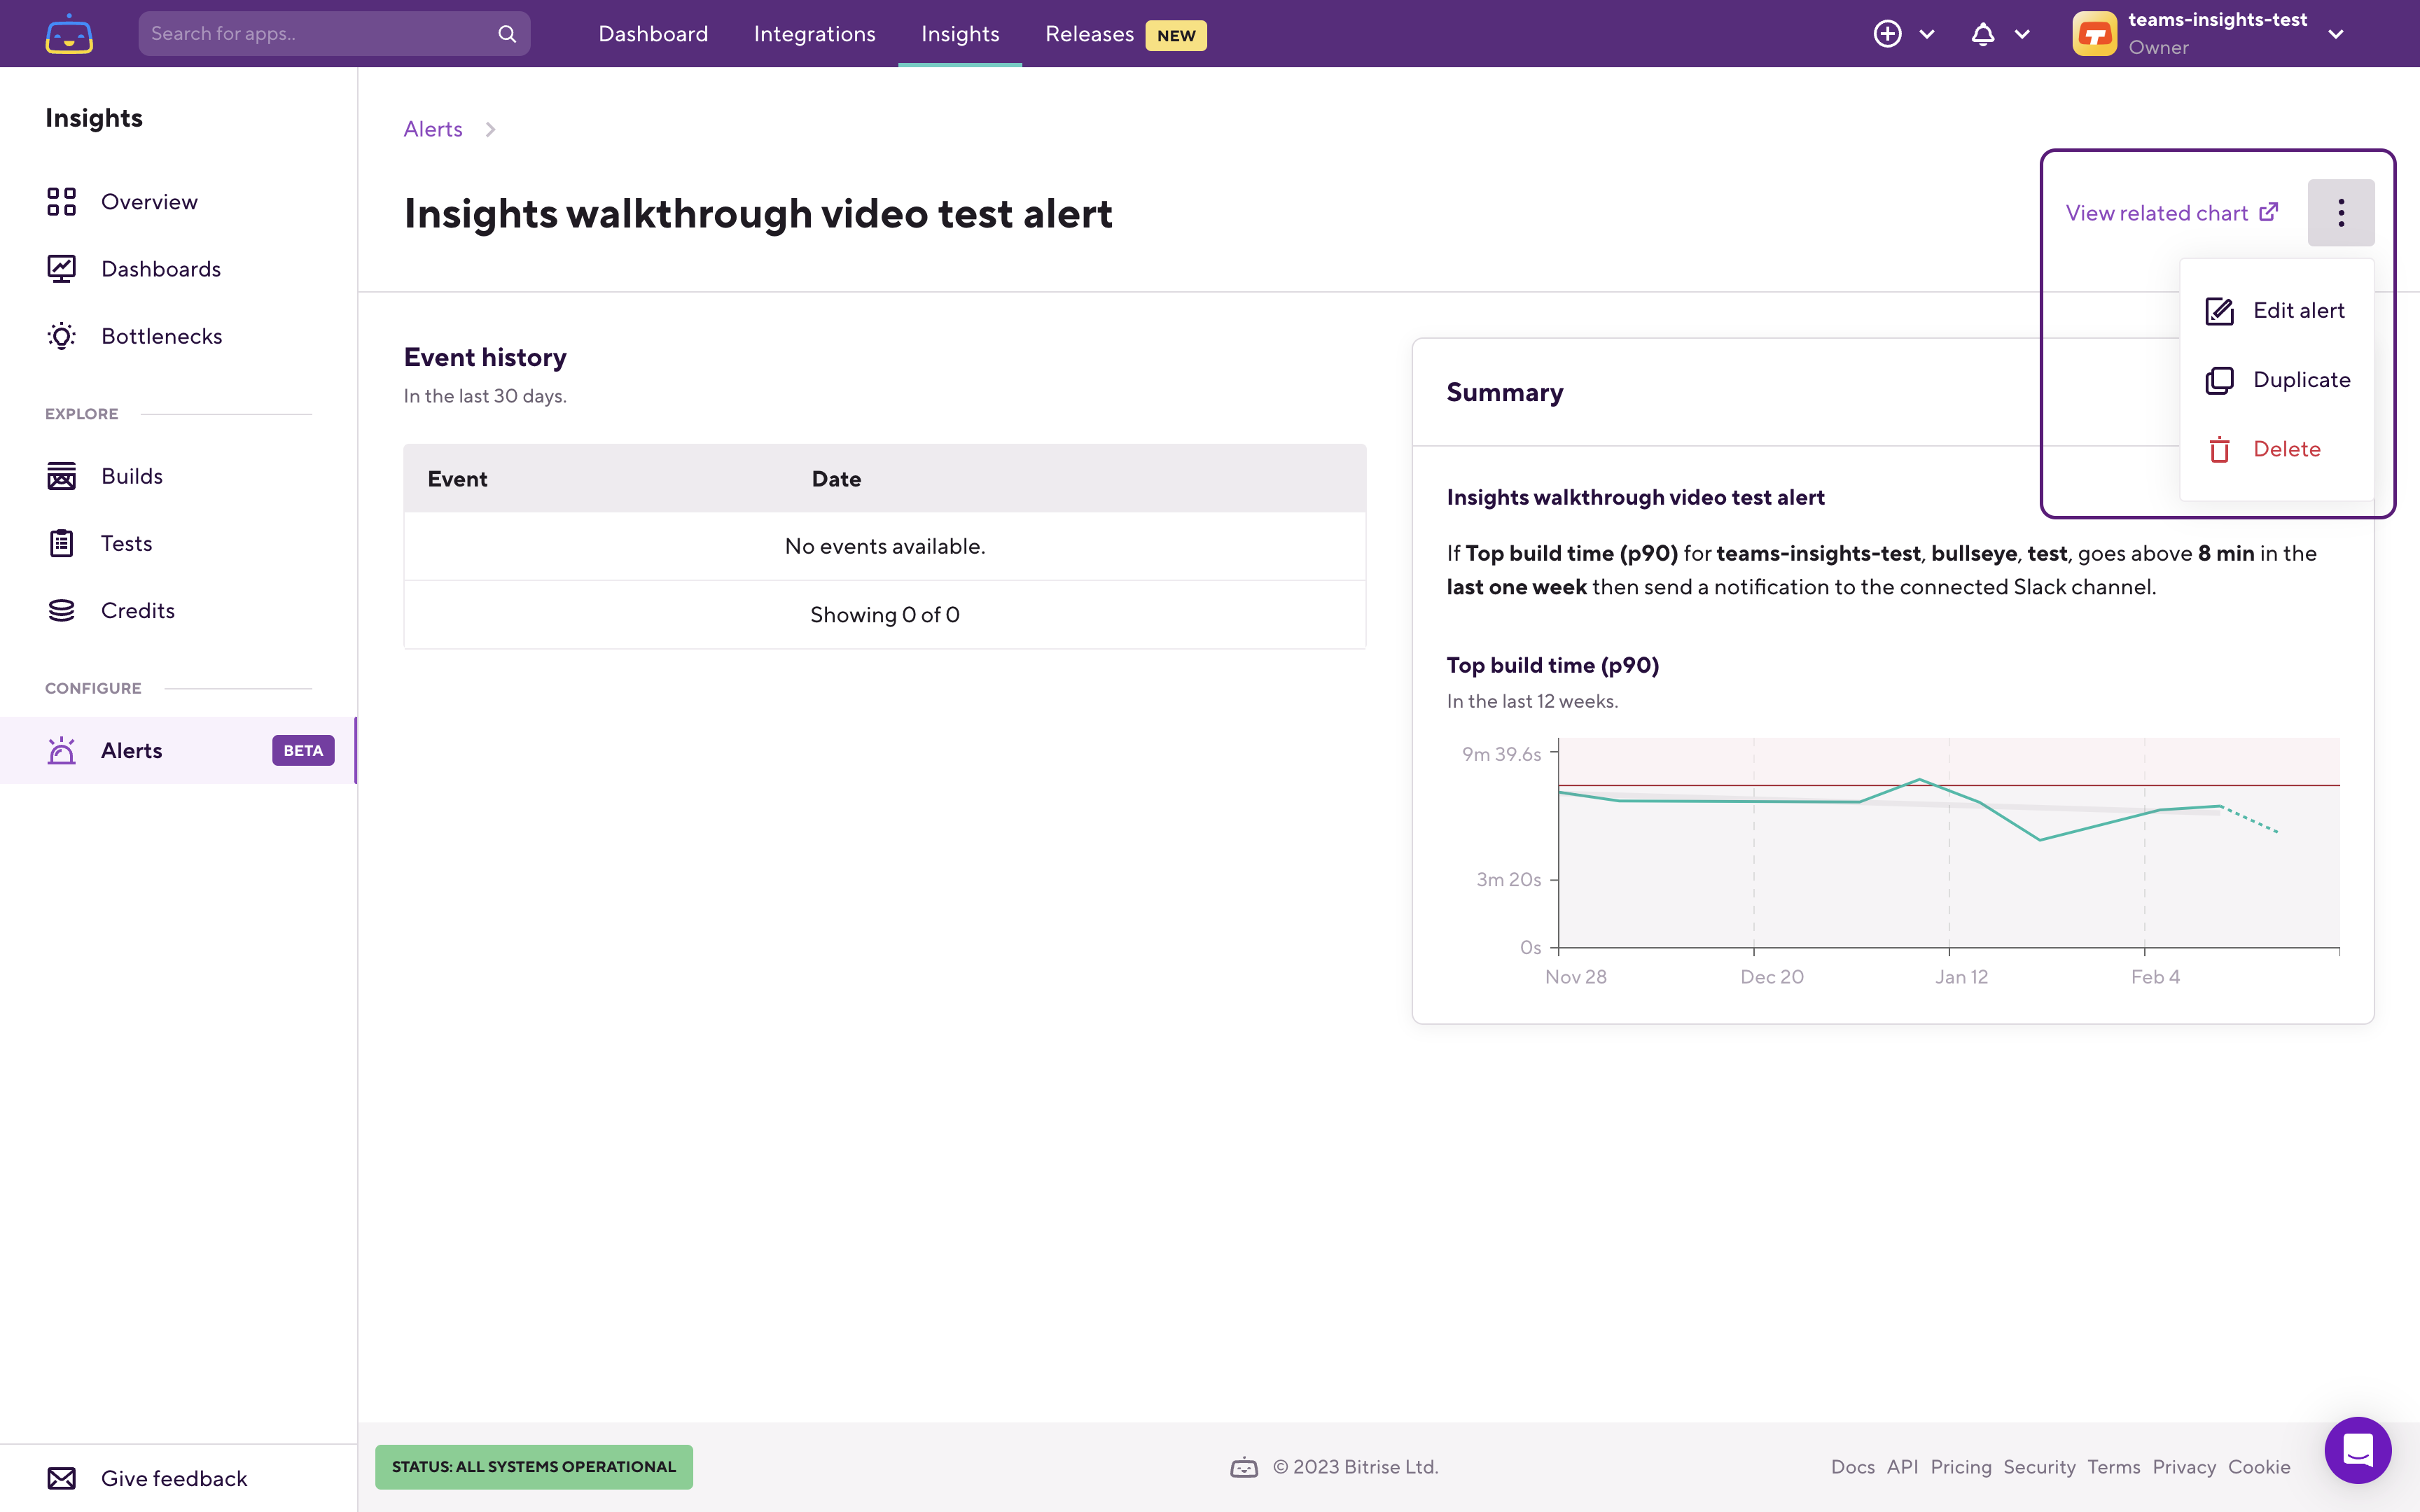
From now, on whenever Bitrise Insights detects the metric that you configured crossed the threshold against what we set it against, it will deliver a Slack message to you. You can check all the alerts previously configured using the Alerts page (which you can find on the left sidebar).
When we select a specific alert we can also edit the alert, duplicate it, and delete it:
Let’s see an example where the alert was already triggered a few times.
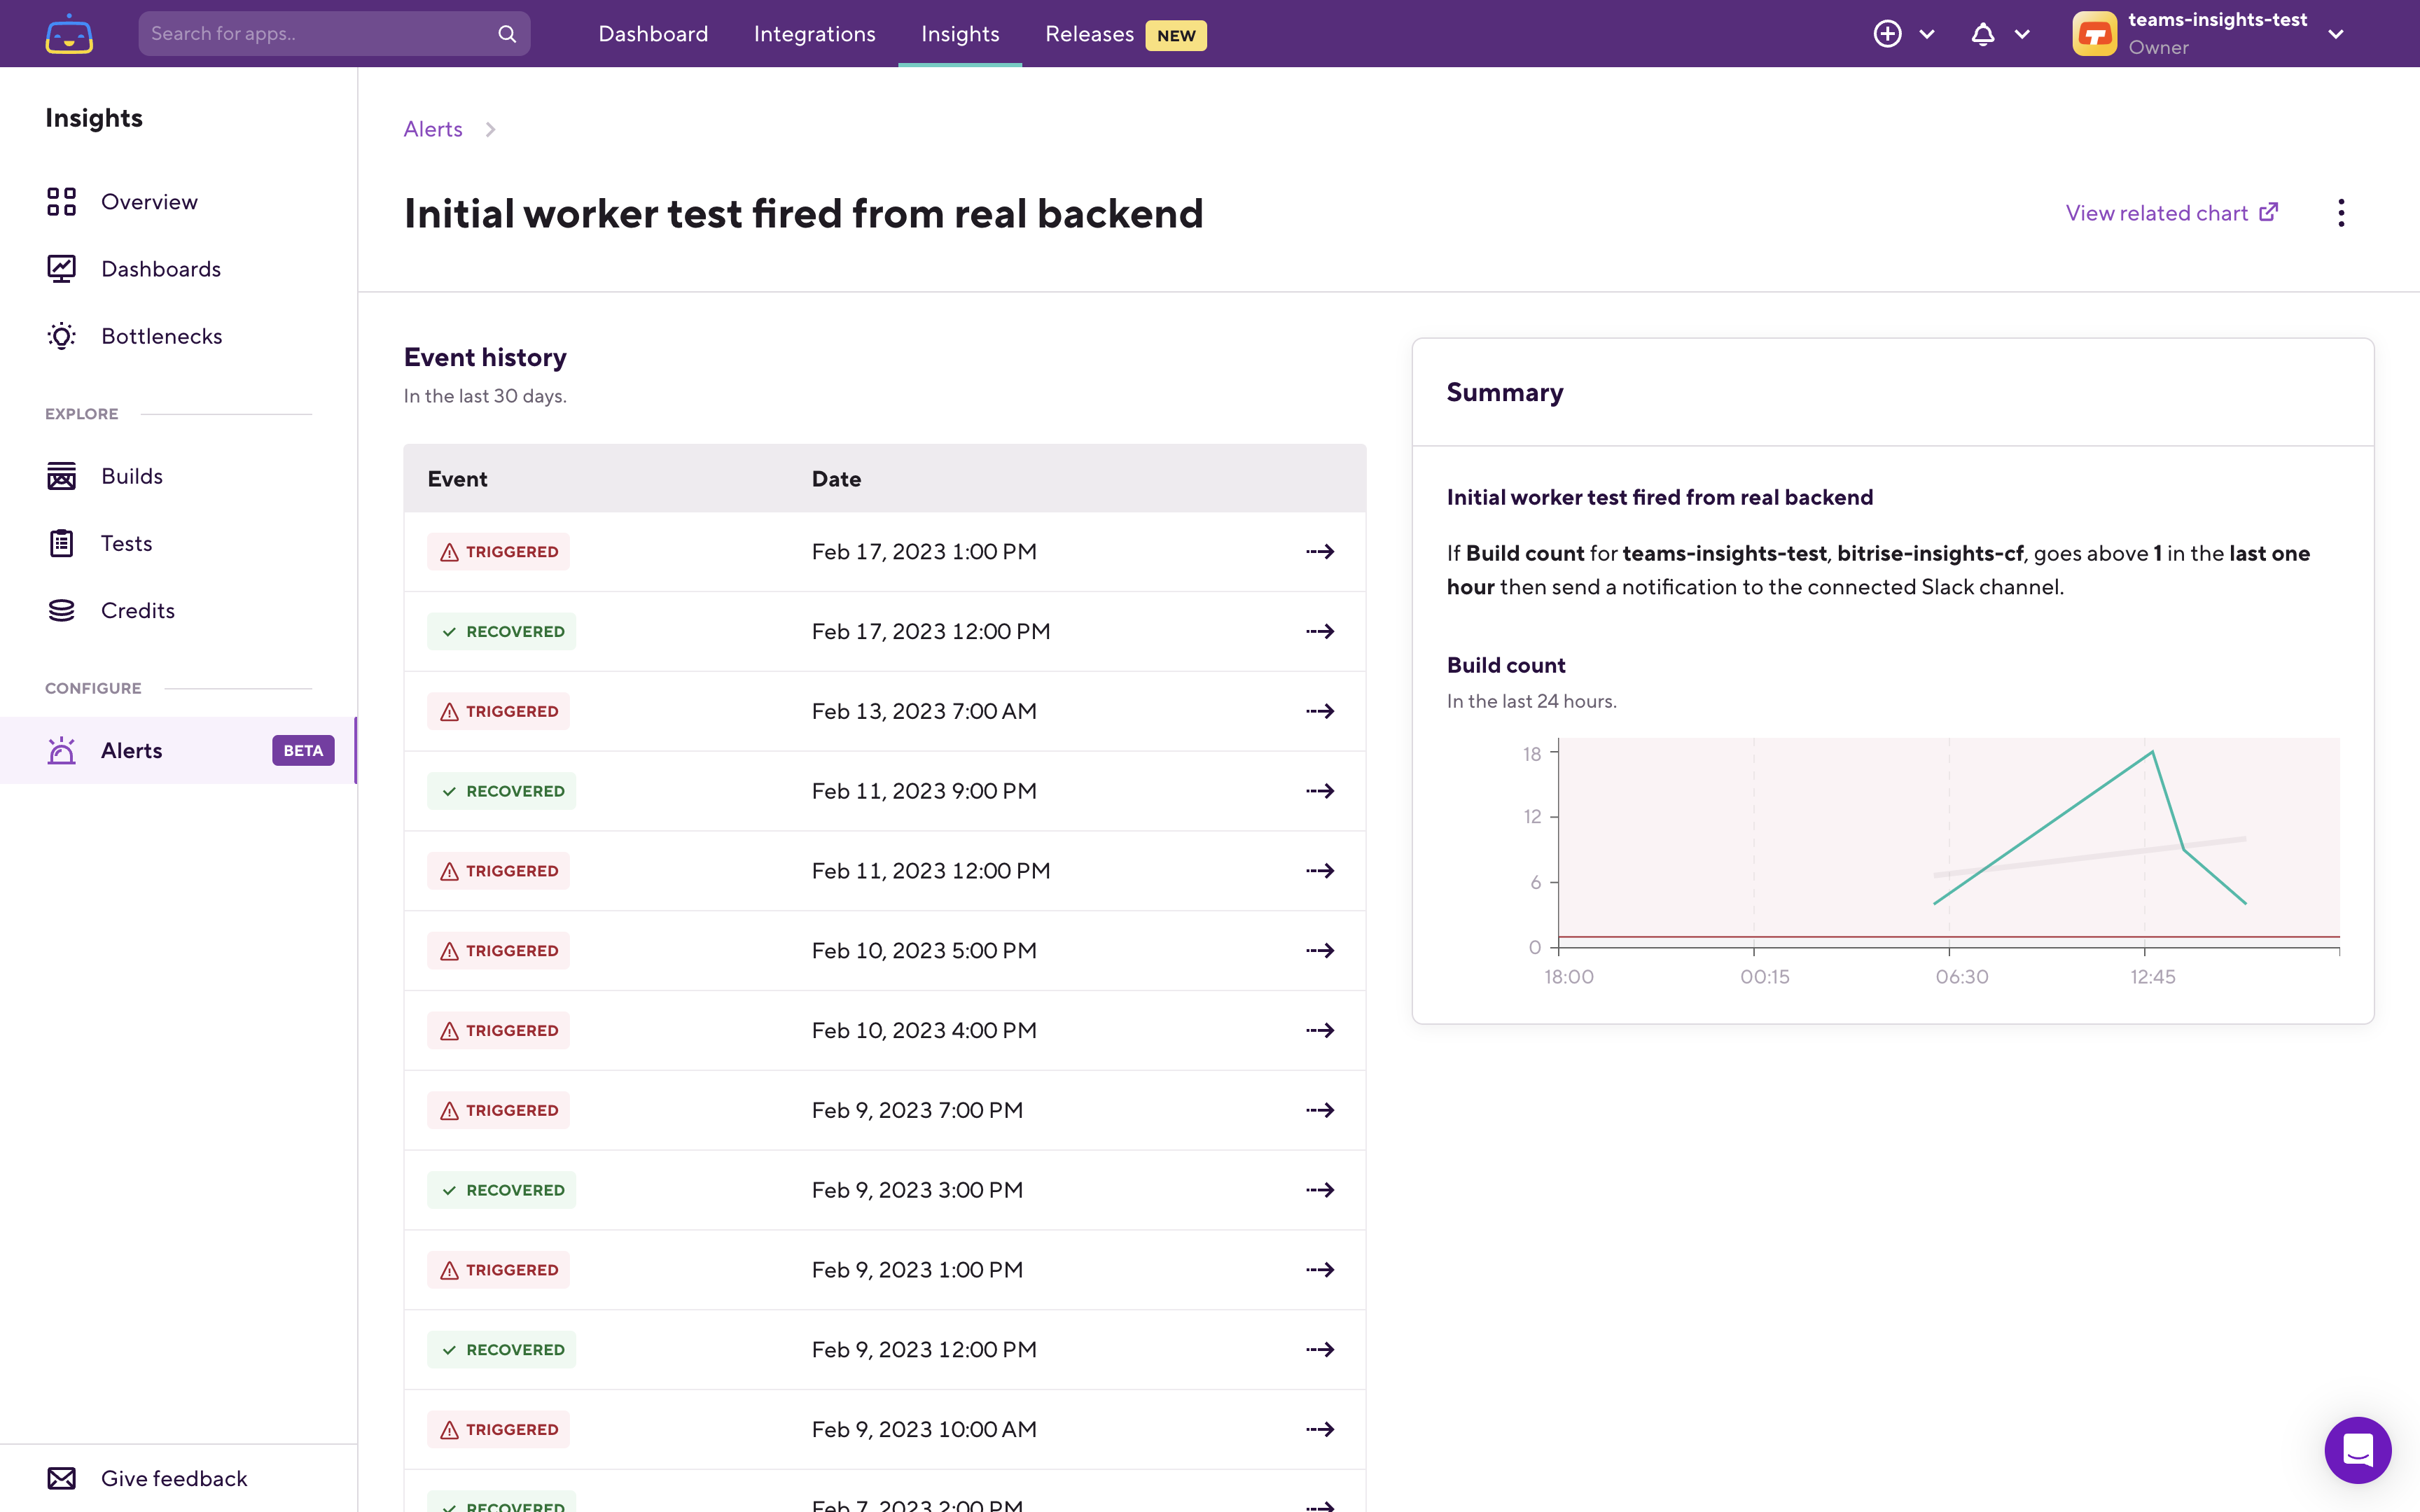
In that case on the alert’s page, you’ll be able to review the event history from the last 30 days. If you click on any of the events that will open the relevant Explore page, with the relevant filters, and will show you what happened:
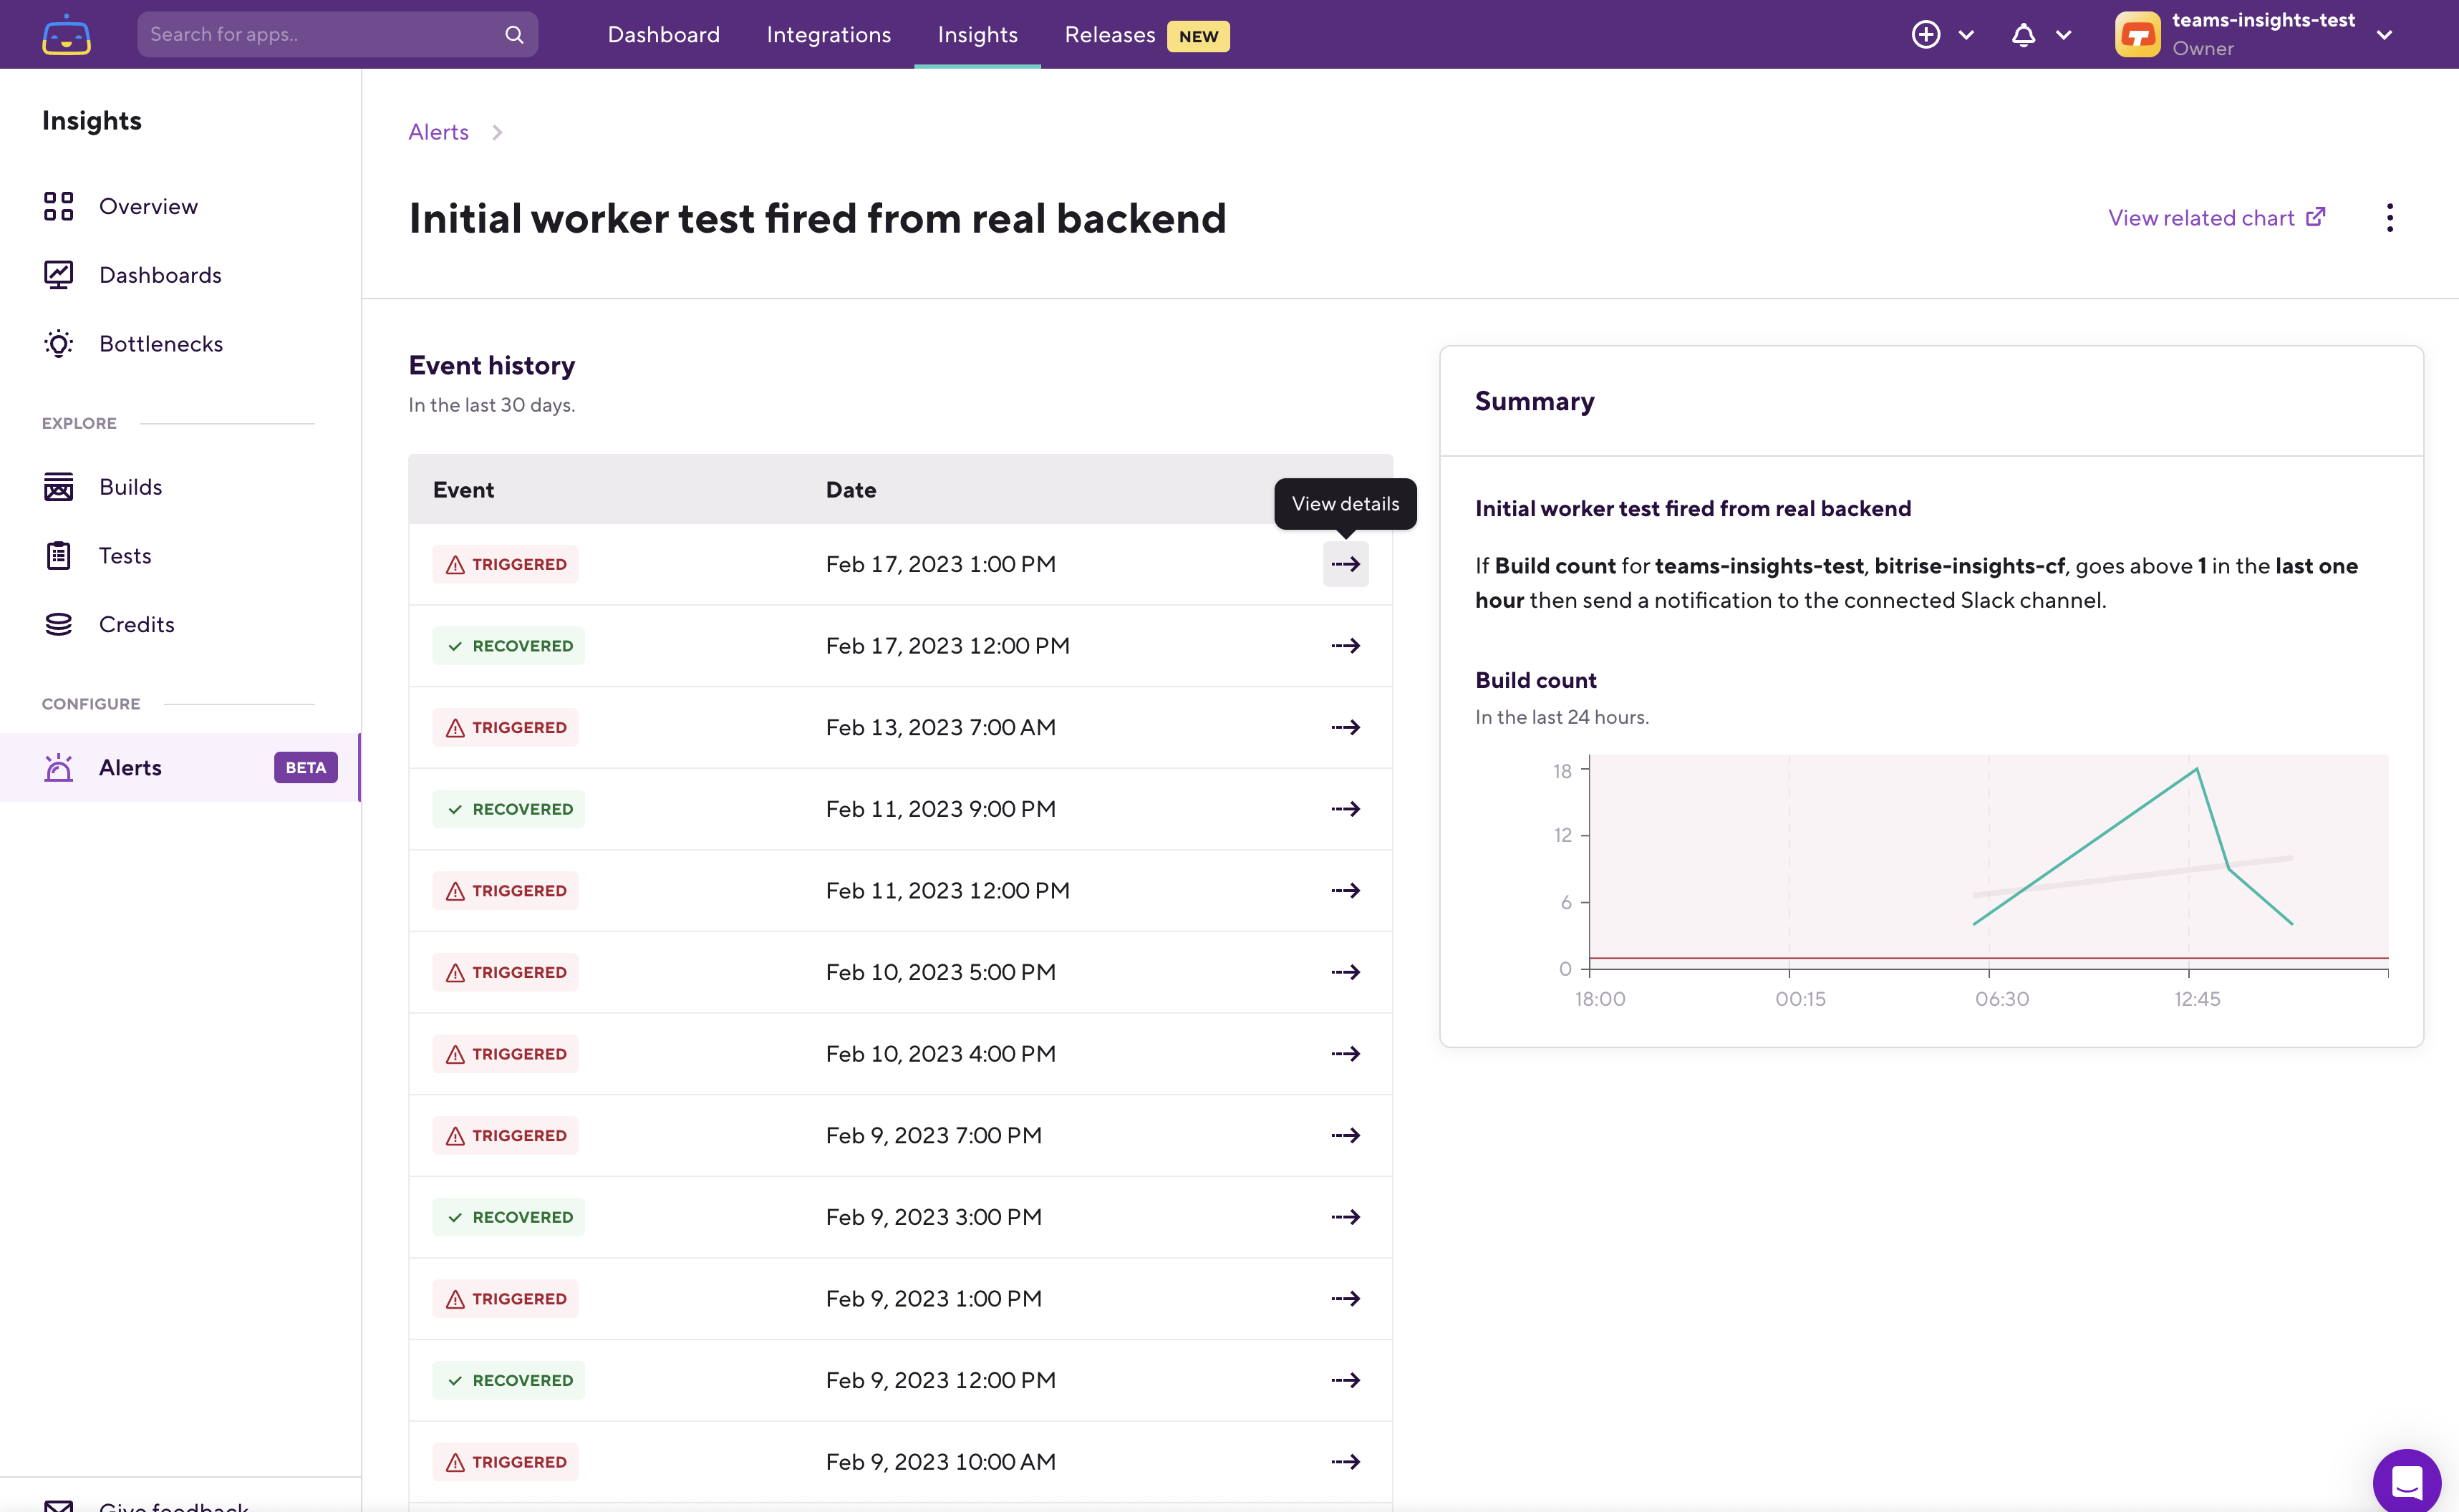
As you can see the vertical line on the upper chart marks where the alert was triggered, and the time frame (in the top right corner) was automatically set so that you can check what happened before the alert was triggered, and what happened after it.
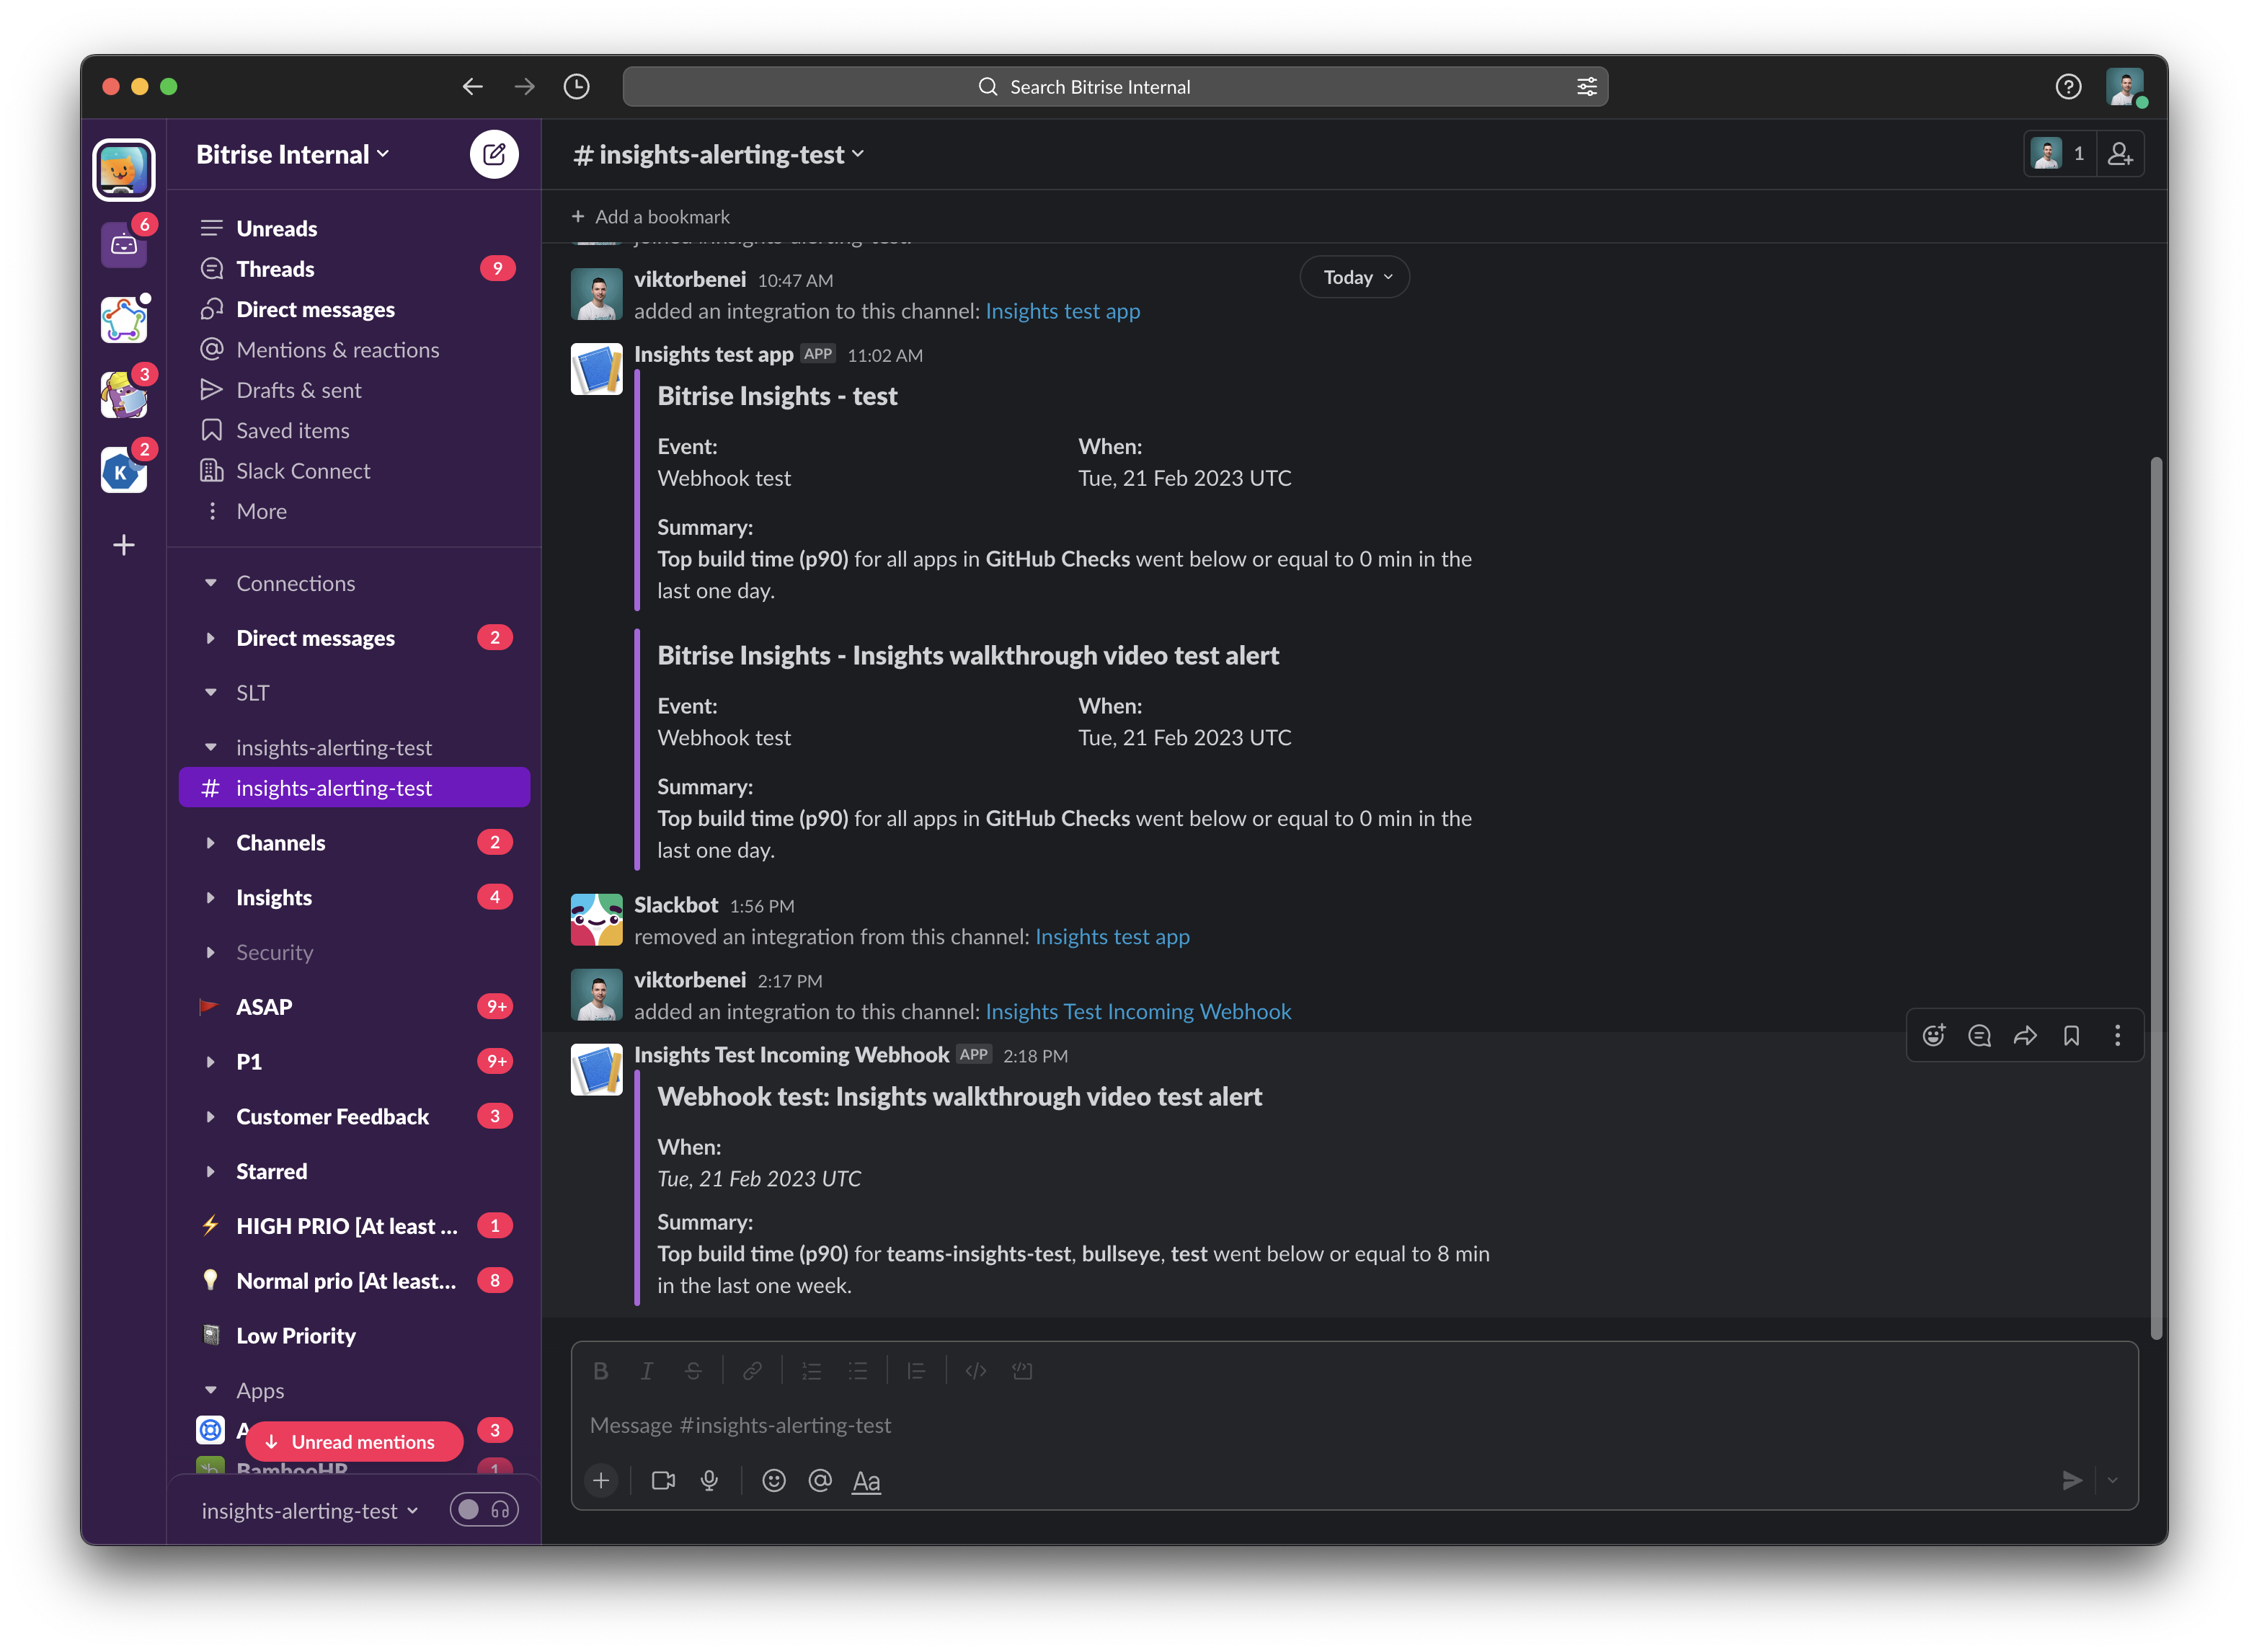
When you receive an alert on Slack it’ll look like this:
%2520(1).png)
You’ll also get a notification when the alert is recovered and when the metric goes back below the threshold.
That’s it, now you know how Alerts work, and also how you can create, delete, edit, and duplicate alerts.
As always we’d love to get your feedback, on the new Alerts feature, or anything related to Insights. For that, you can use the Give feedback button in the bottom left corner on any of the Bitrise Insights pages.