Hi everyone, I’m Viktor from Bitrise, and this is a quick walkthrough of the new Pipeline Insights feature.
A quick note: These changes only affect apps that are using the Pipelines feature of Bitrise.
On the surface, the changes might seem minor, but Pipeline Insights actually affects many places in Bitrise Insights.
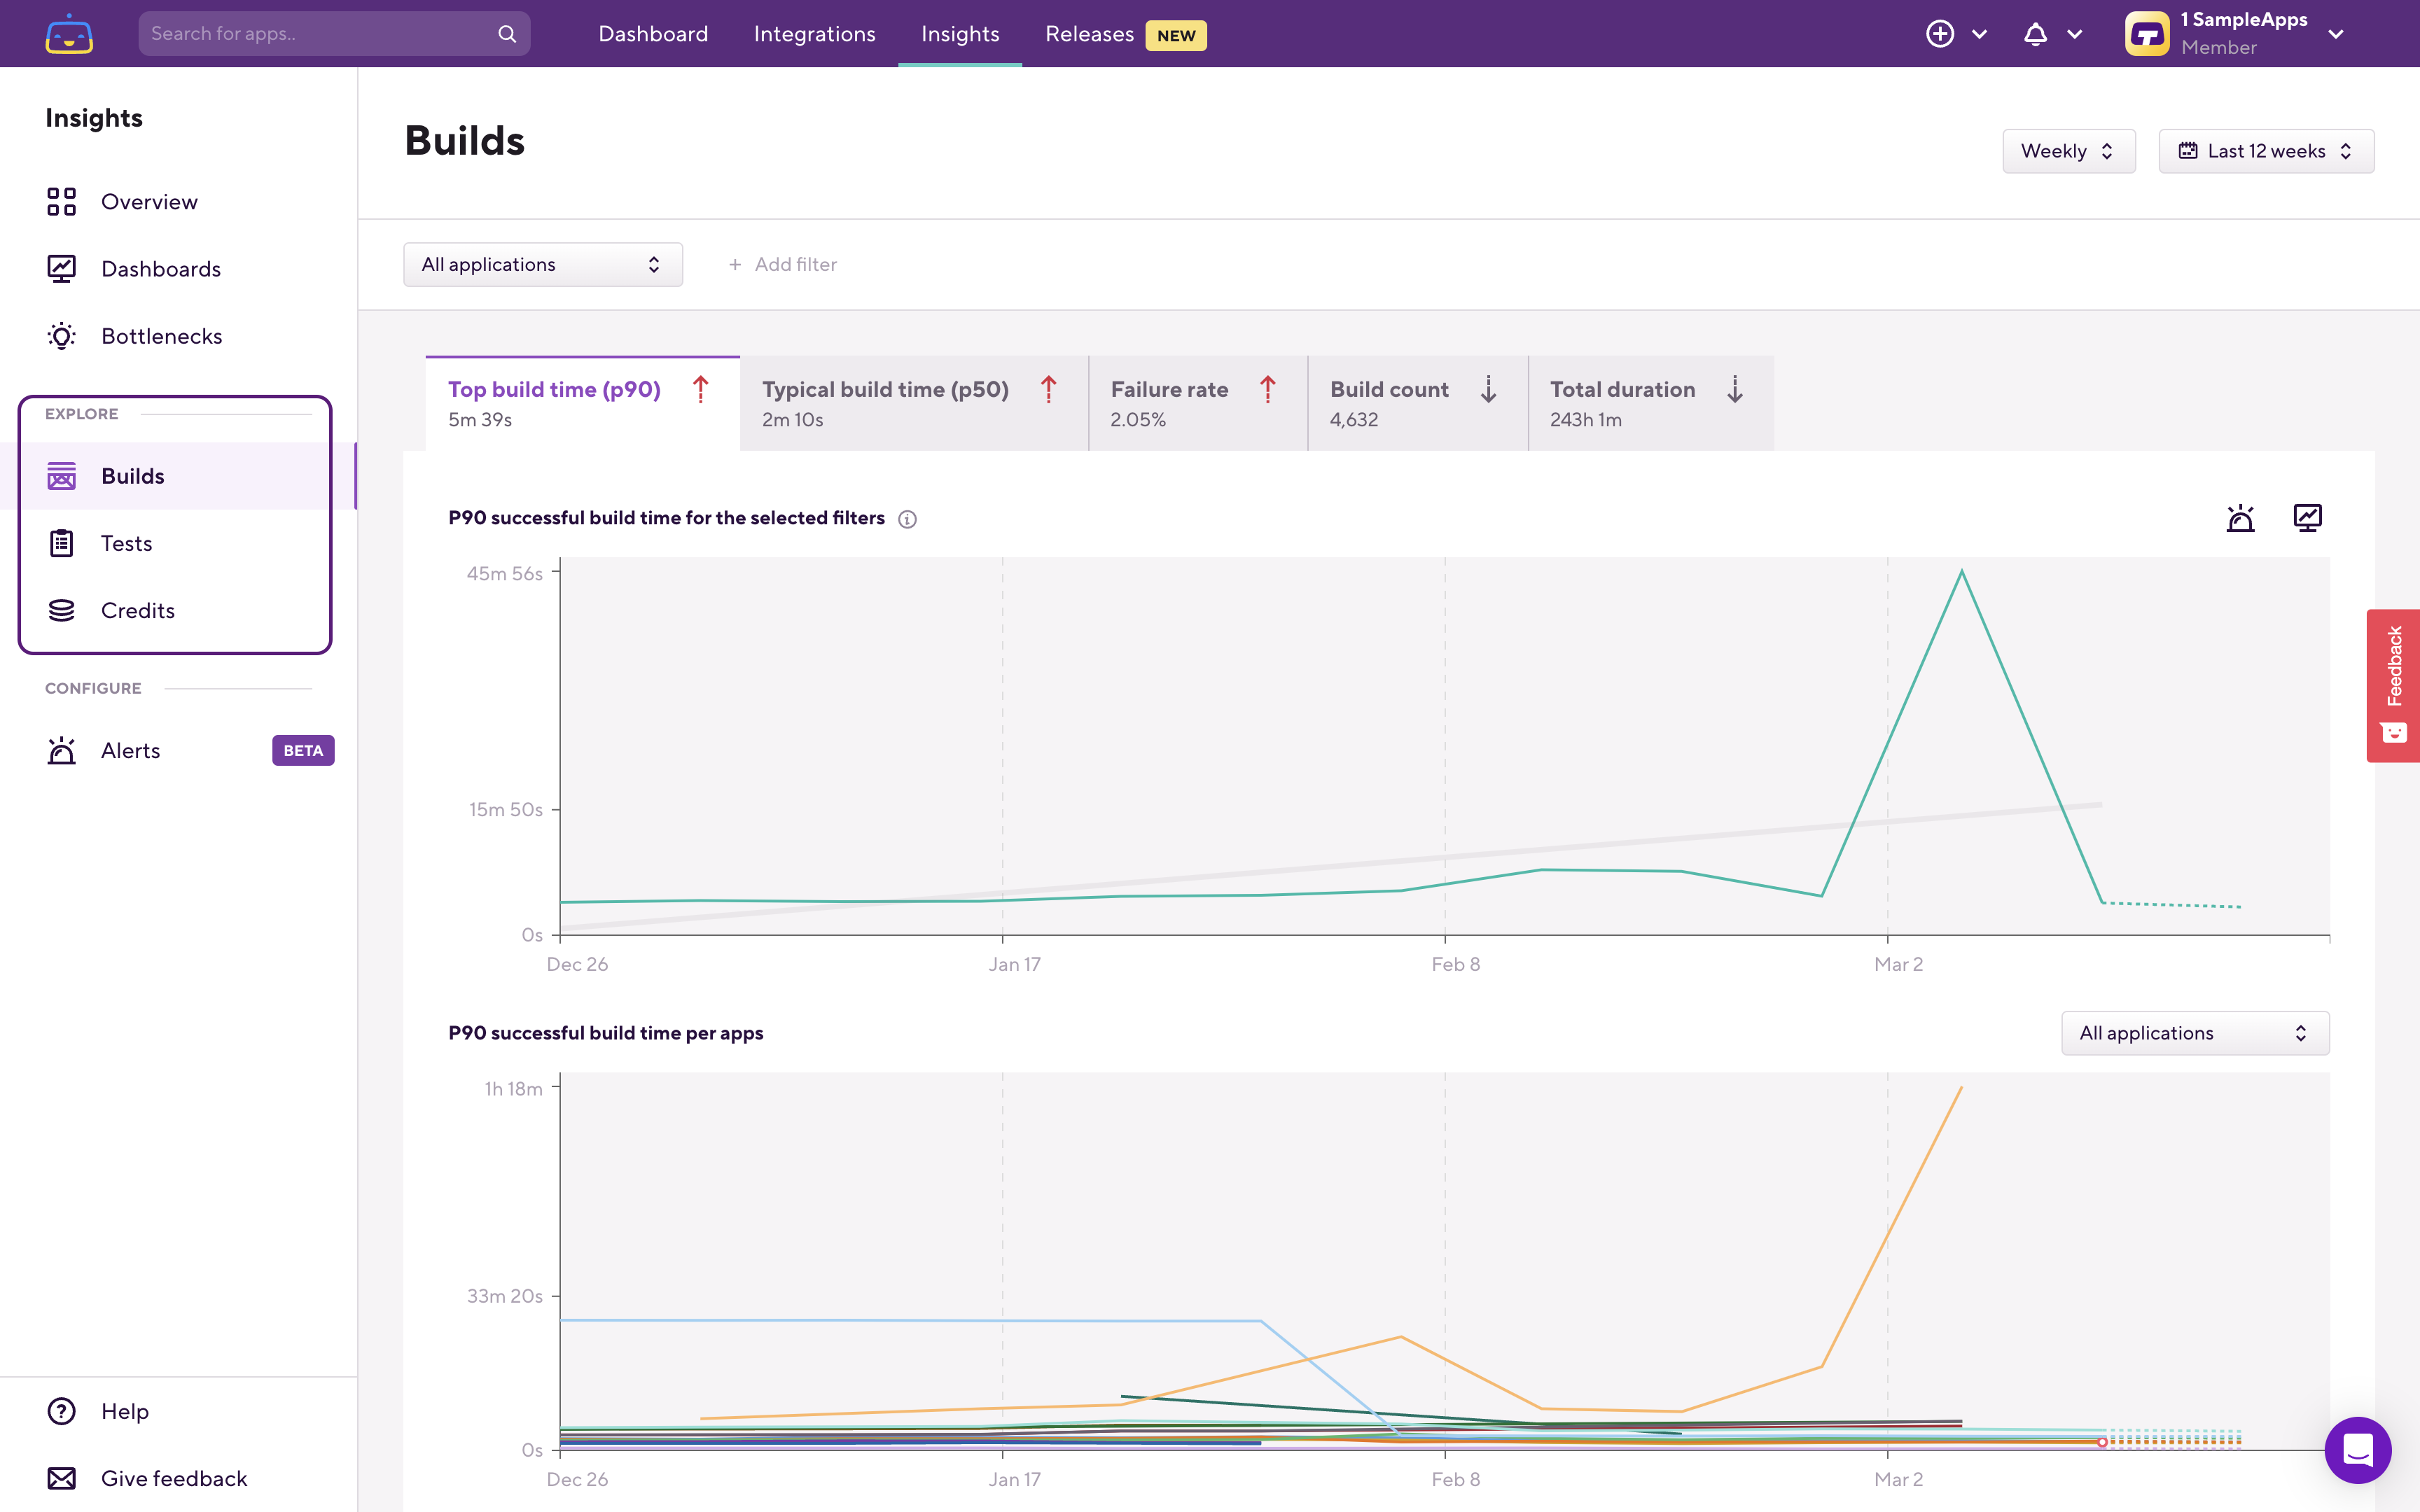
Let’s start with the most visible changes on the UI. Open Bitrise Insights, and switch over to the Explore > Builds page.
On all the Explore pages, you can now select Pipelines and Stages in addition to Workflows in the filters at the top:
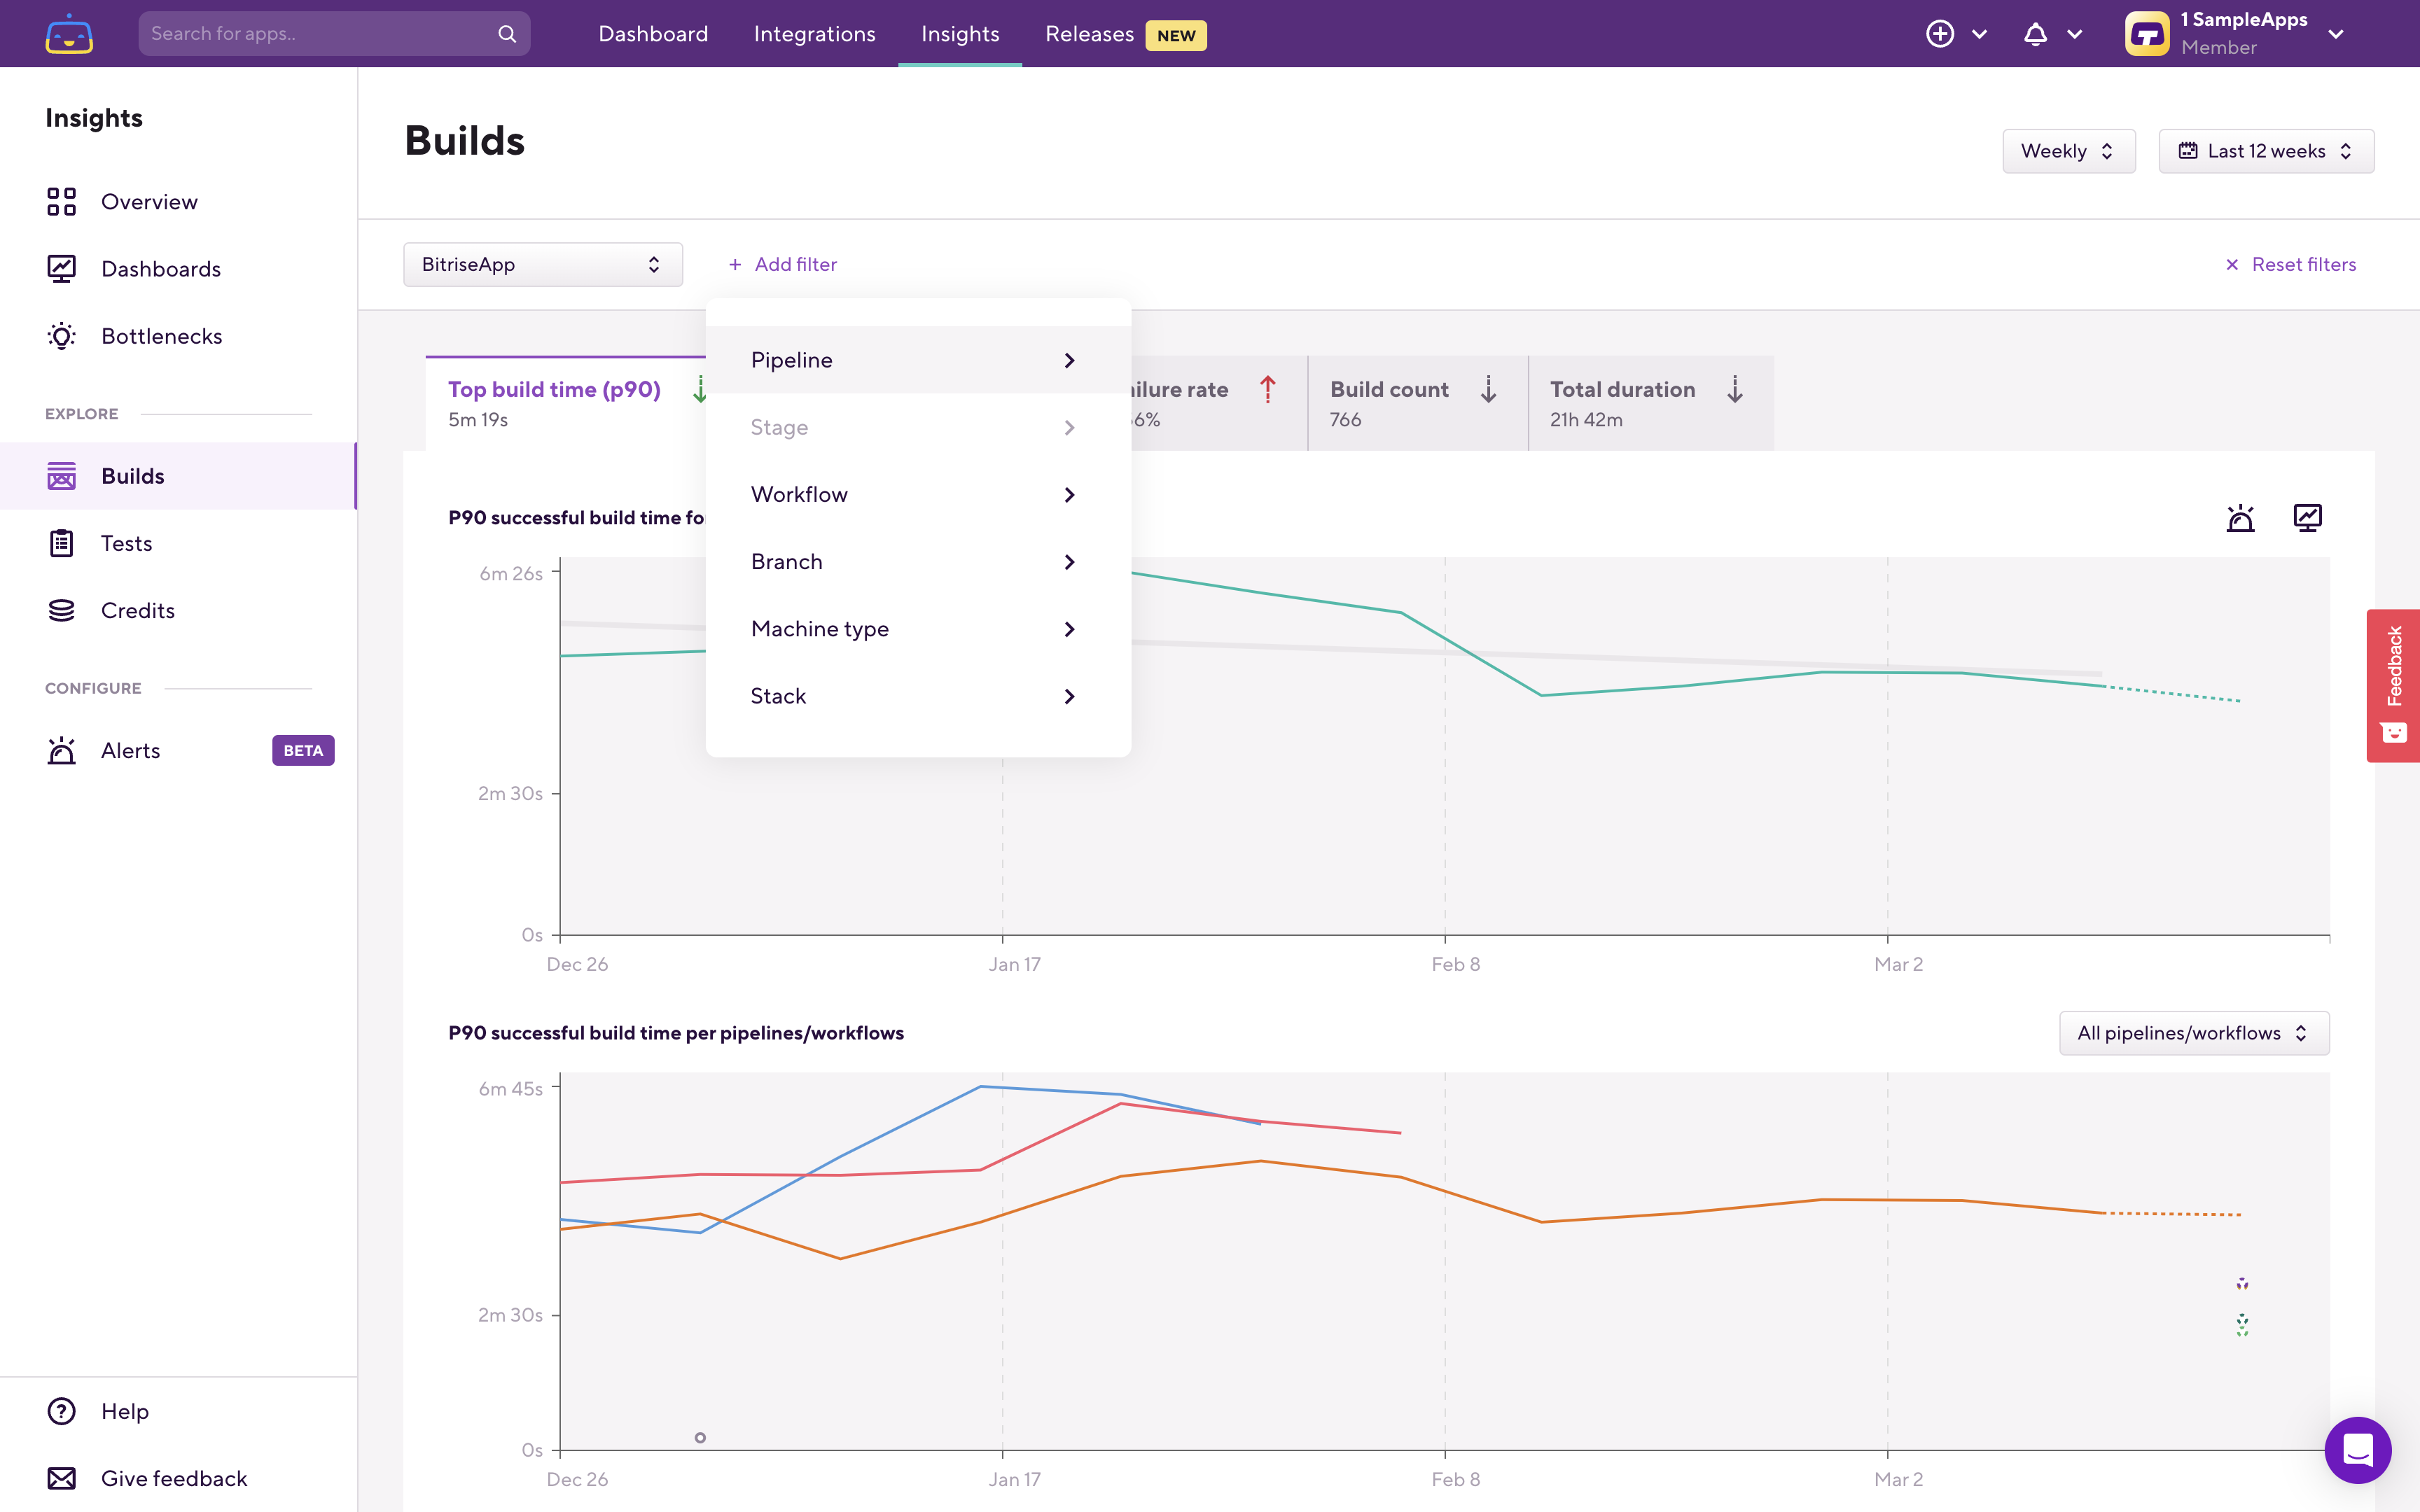
The filter UI also changed a bit to make it easier to work with the increased number of filter options. An added benefit of the new filter UI is that it’s significantly easier to see exactly which filters you have set, and also to remove specific filters one by one:

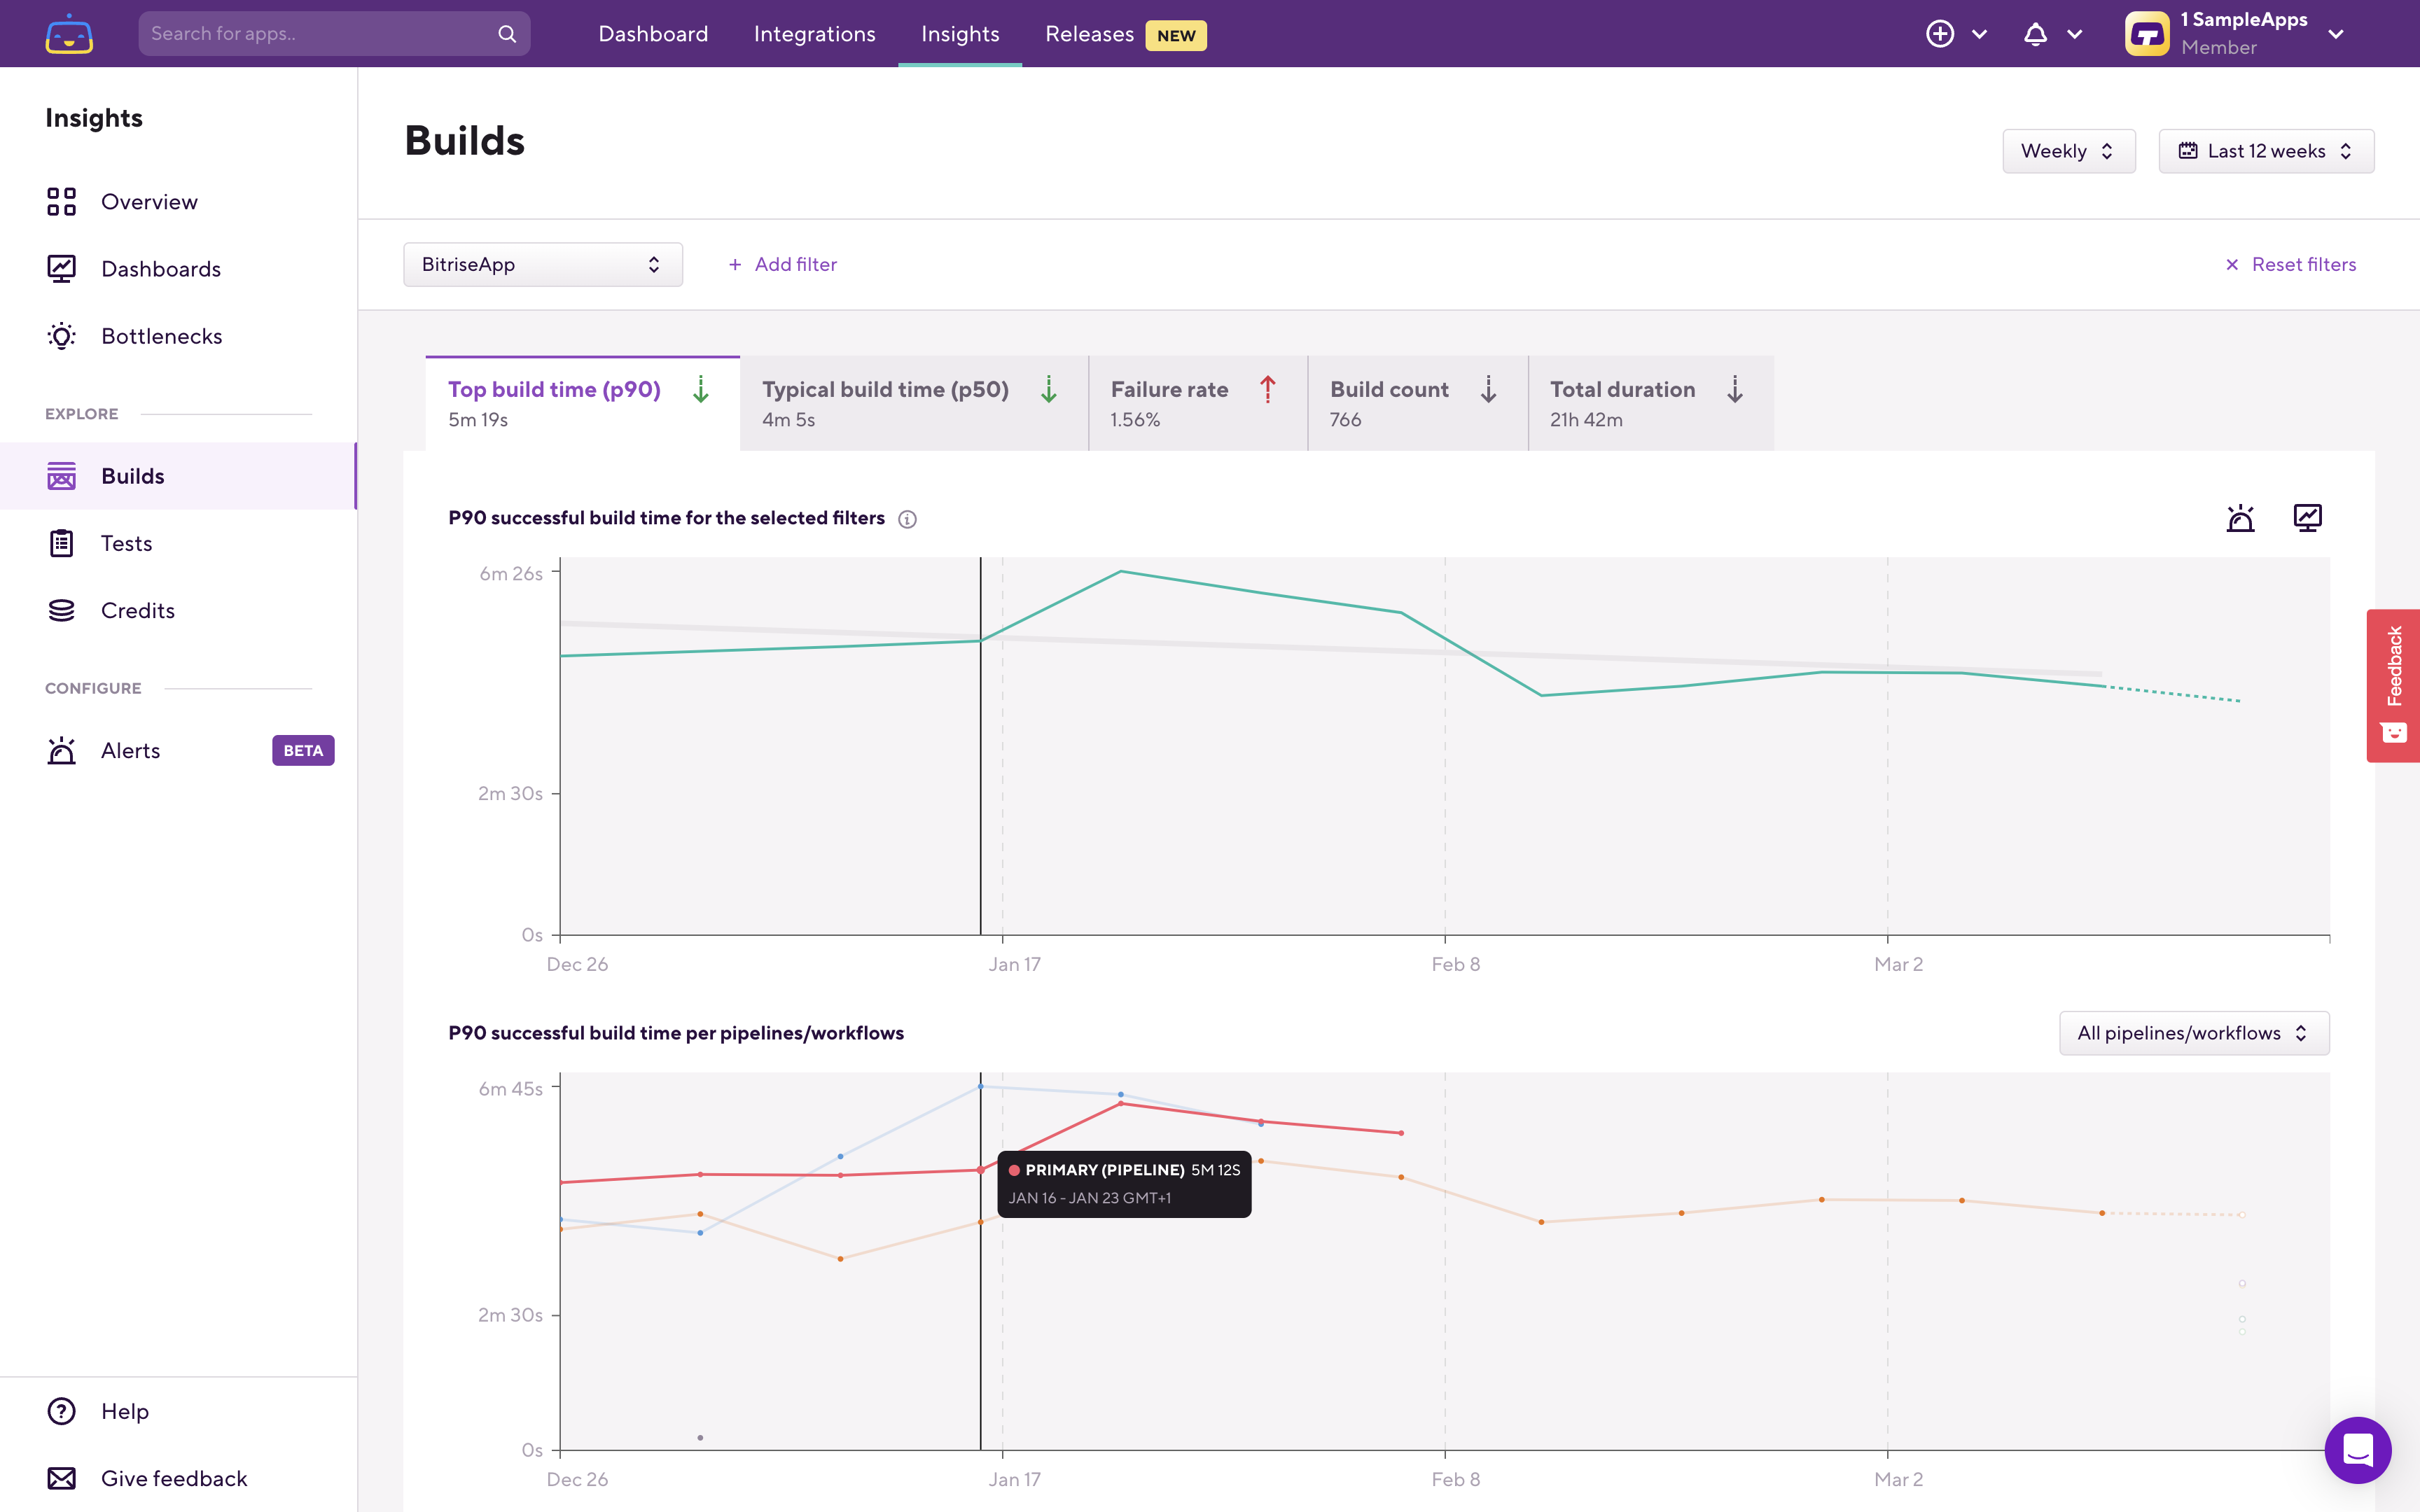
Once you filter on an application, the breakdown chart will now show you the Pipeline level information instead of showing Workflow-level information.
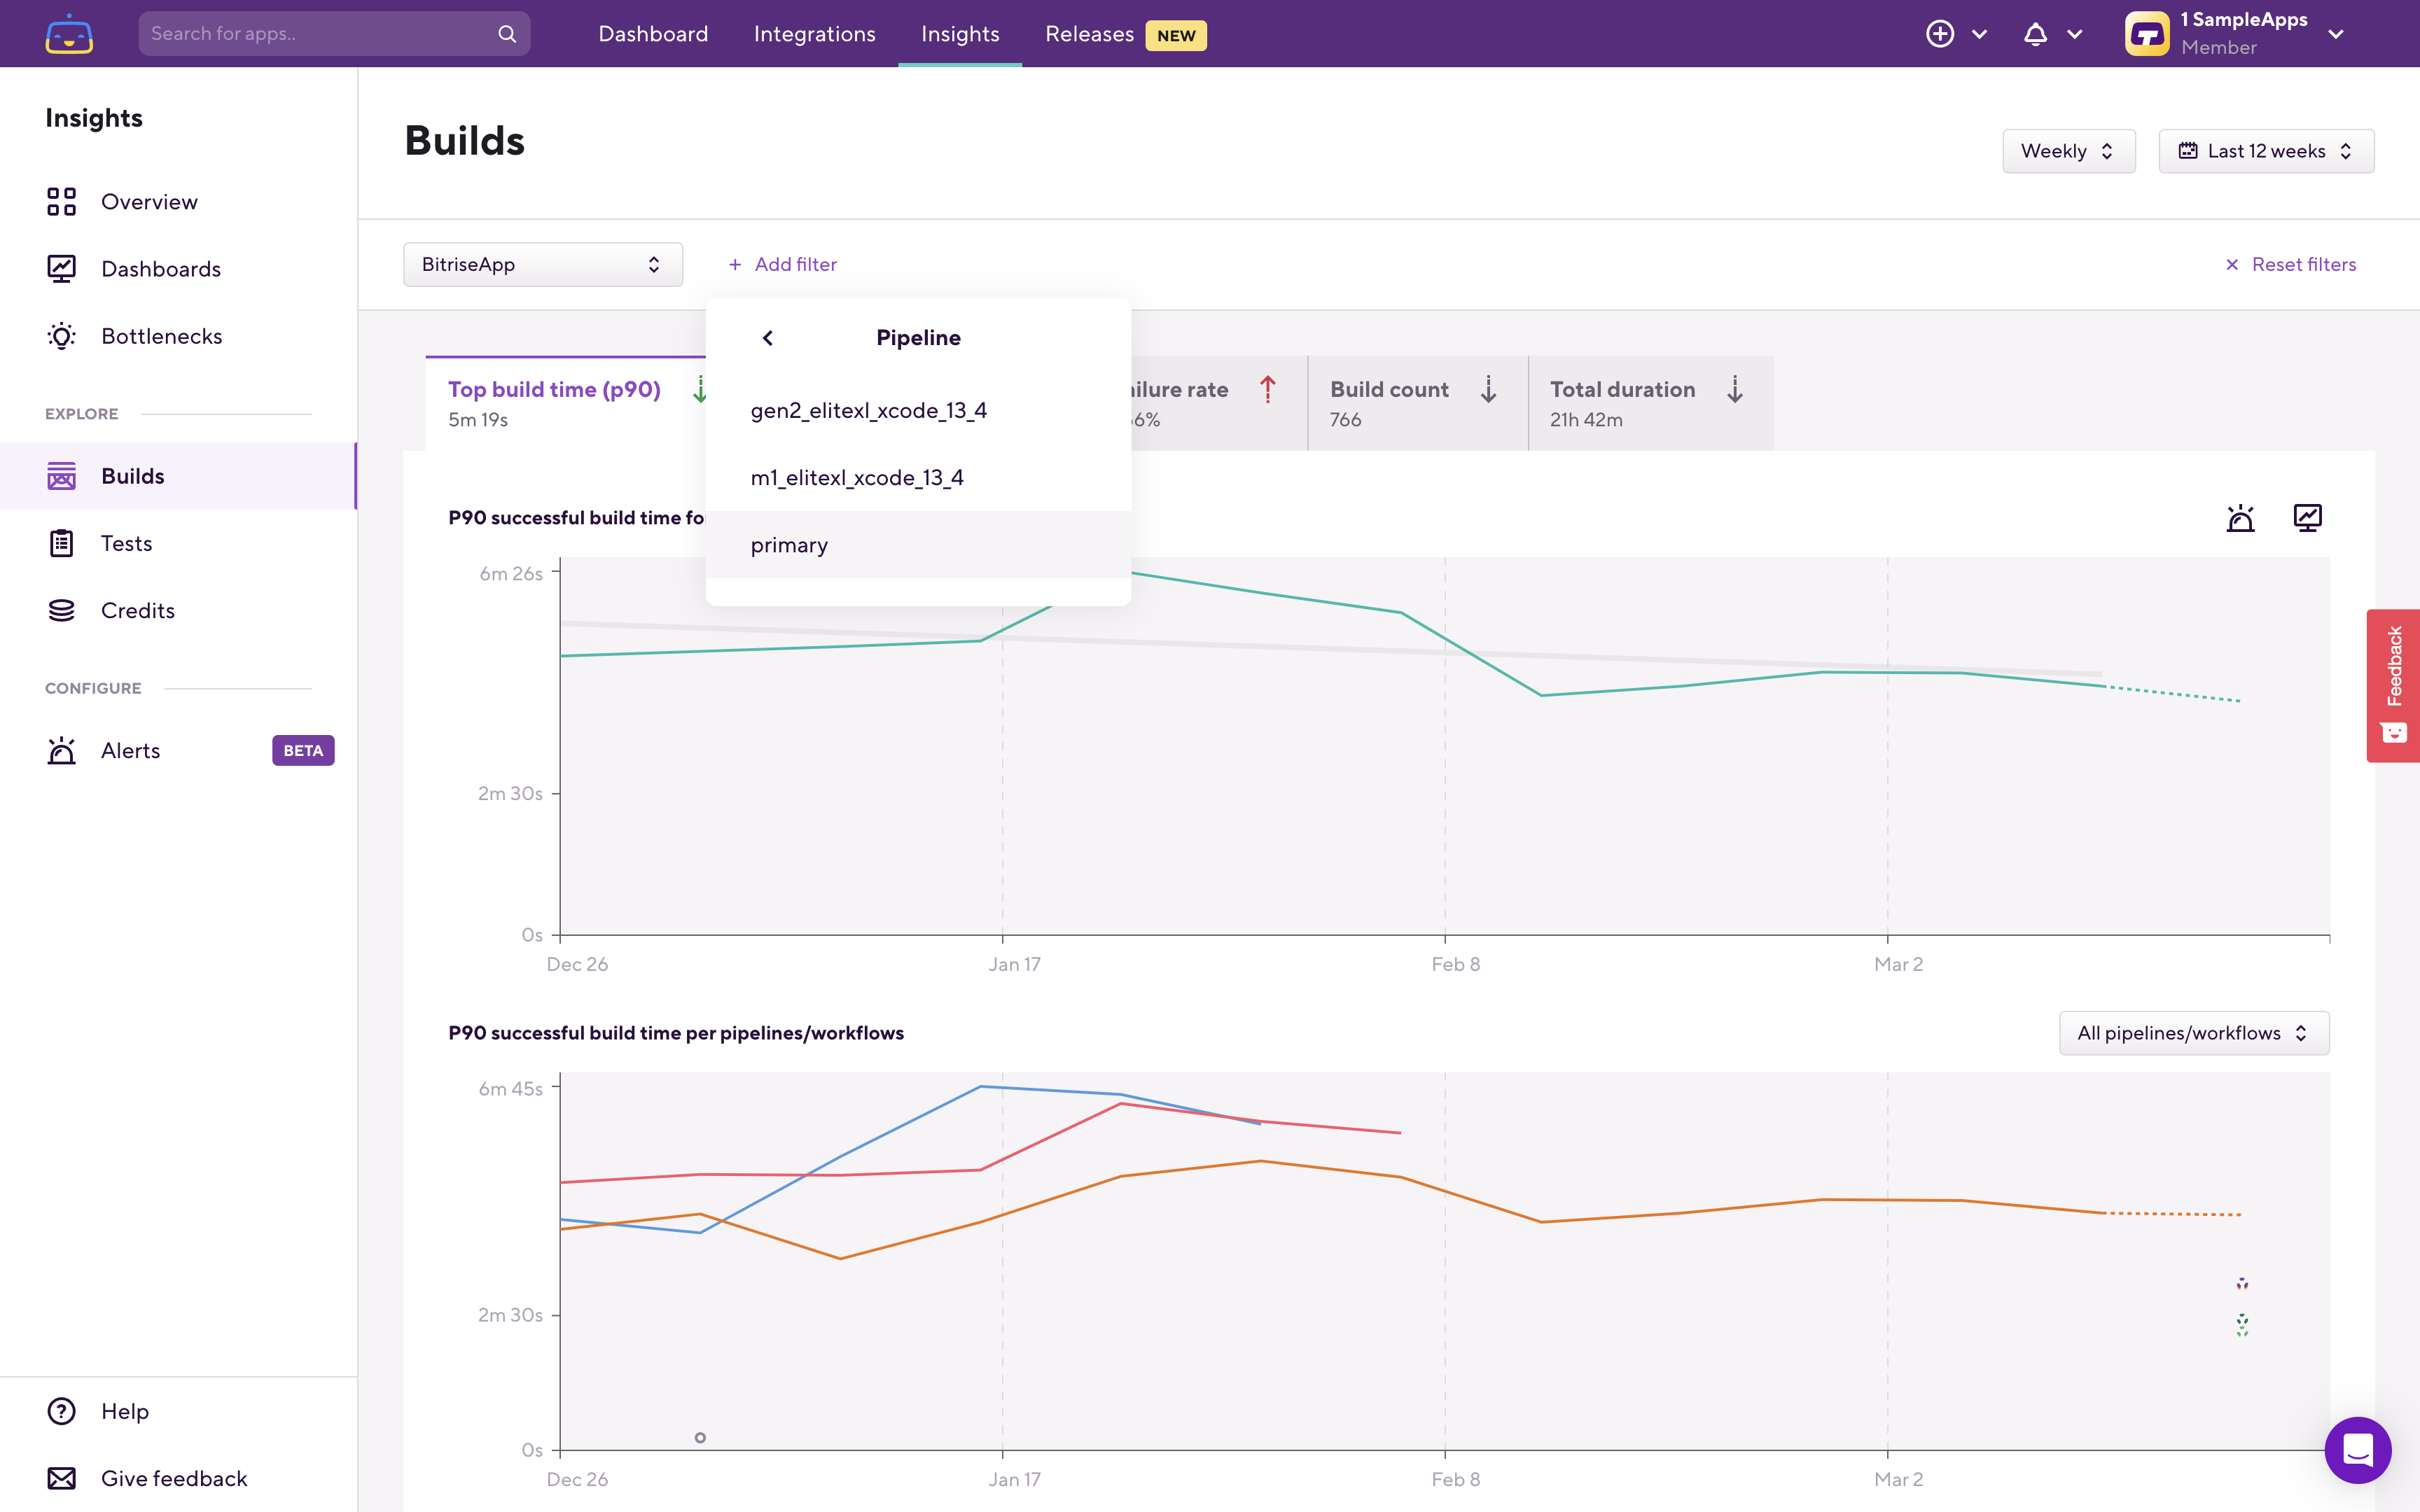
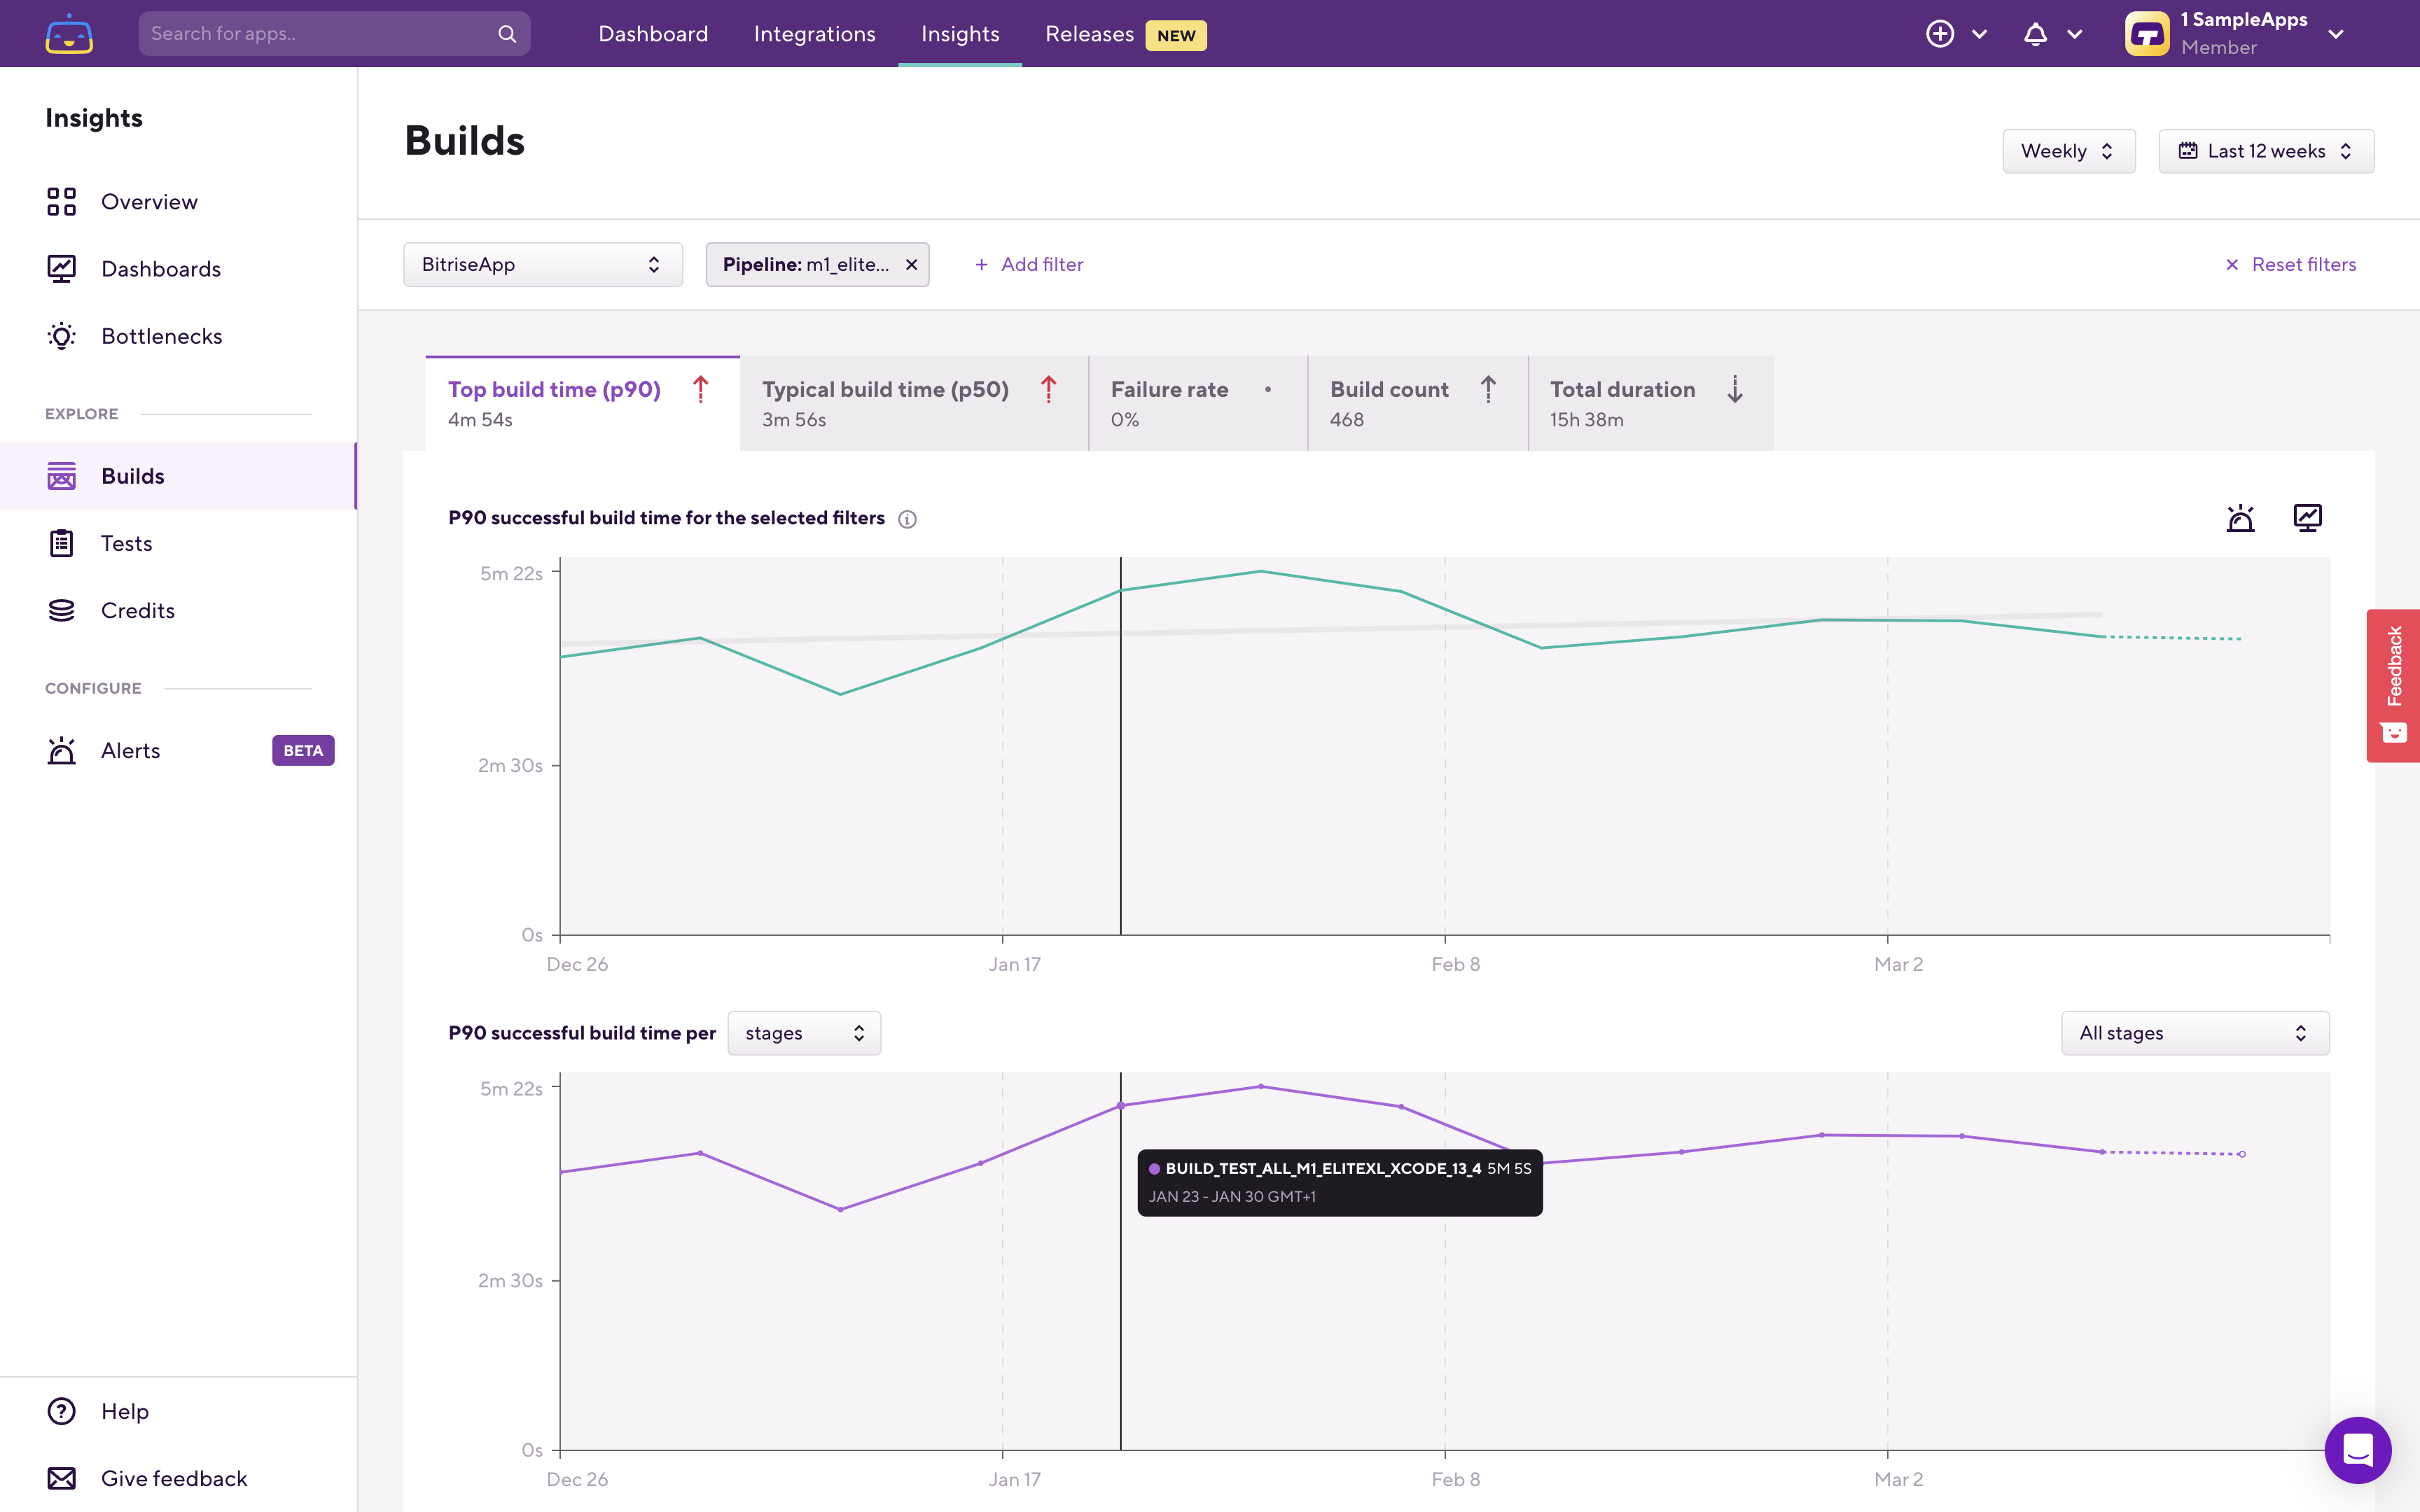
From here, you can filter down to the Pipeline you’re investigating, and you’ll see a per Stage breakdown:
Once you also filter down to a specific stage, you’ll see the familiar Workflow level breakdown. For more information about filters and breakdowns see: Monitoring and optimizing your mobile builds - what, why and how to track.
Filtering on a Workflow works the same way as before, which will show you the per Step breakdown.
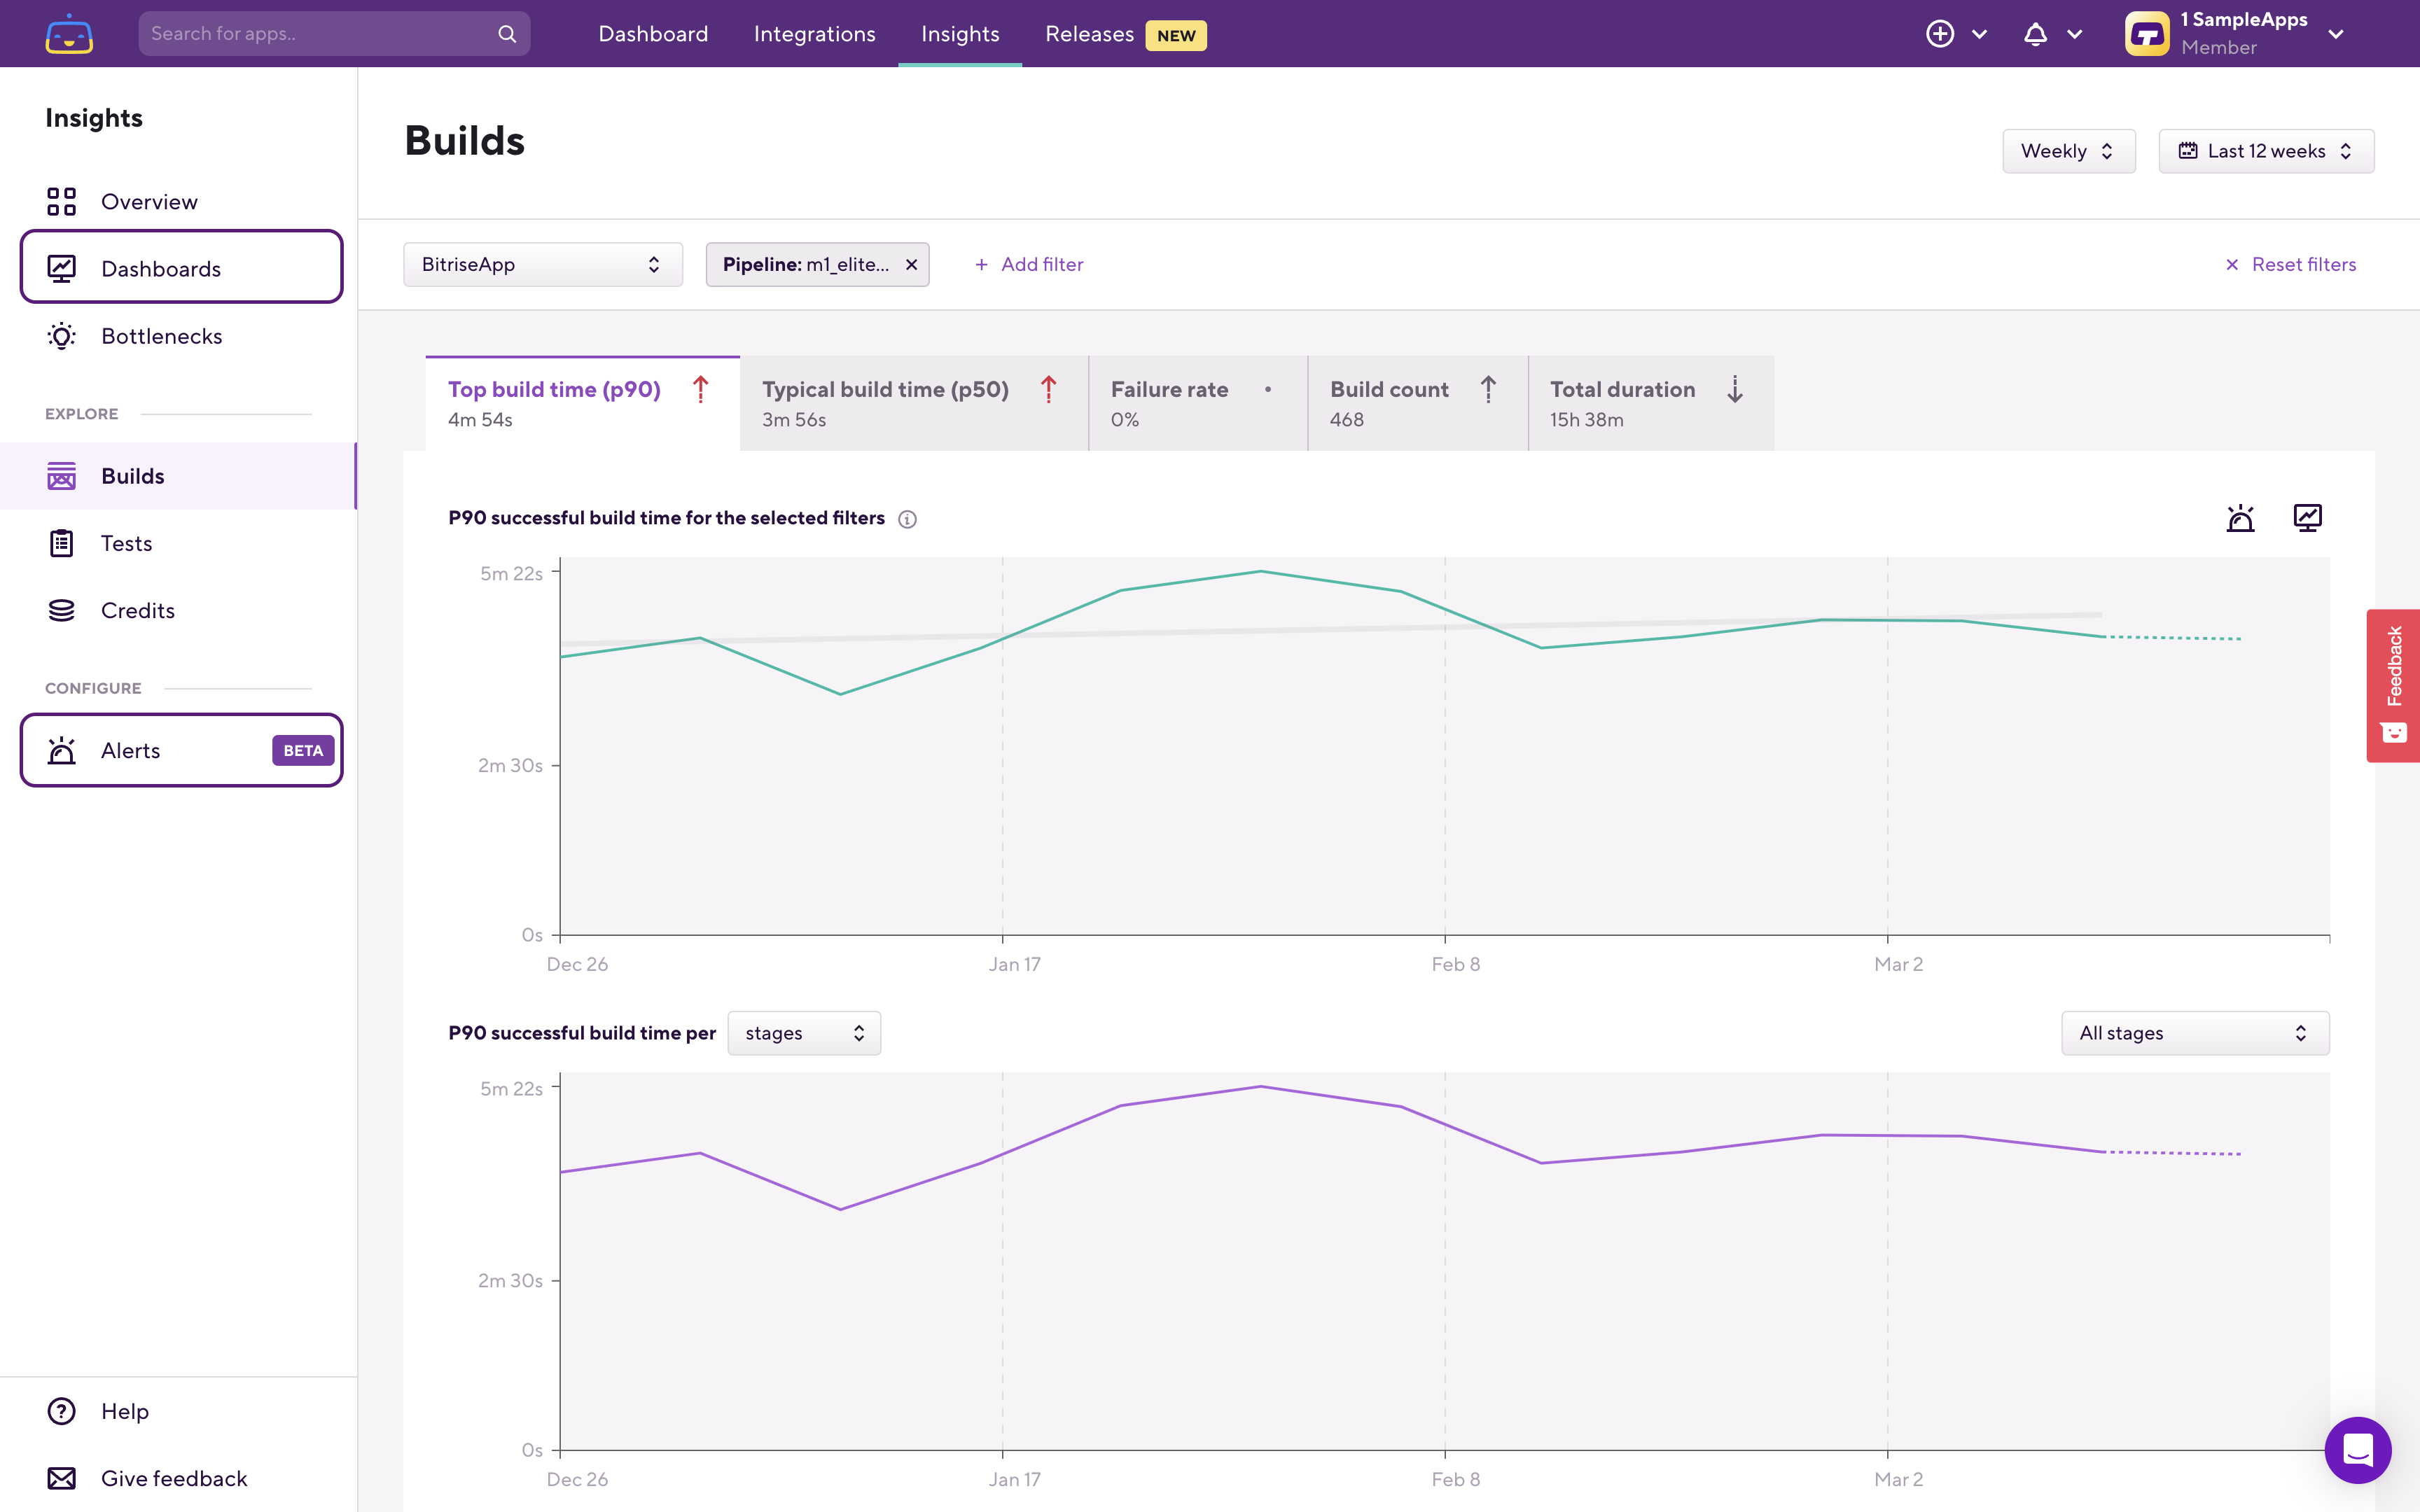
Alerts and Dashboards now also support Pipeline and Stage filters.
An important change that is harder to see is how certain Build metrics are calculated. The Build Time (Top build time (p90) and Typical build time (p50)) and Failure rate calculations on App and on Workspace level changed. Both of these are now calculated from the Pipelines' run time and failure rate, instead of from Workflow level builds' information.
This means that if you don’t have any filters selected, so you’re checking the Workspace’s build time or failure rate those numbers and charts will now use the Pipelines' duration and failure rate to calculate the Workspace level aggregate.
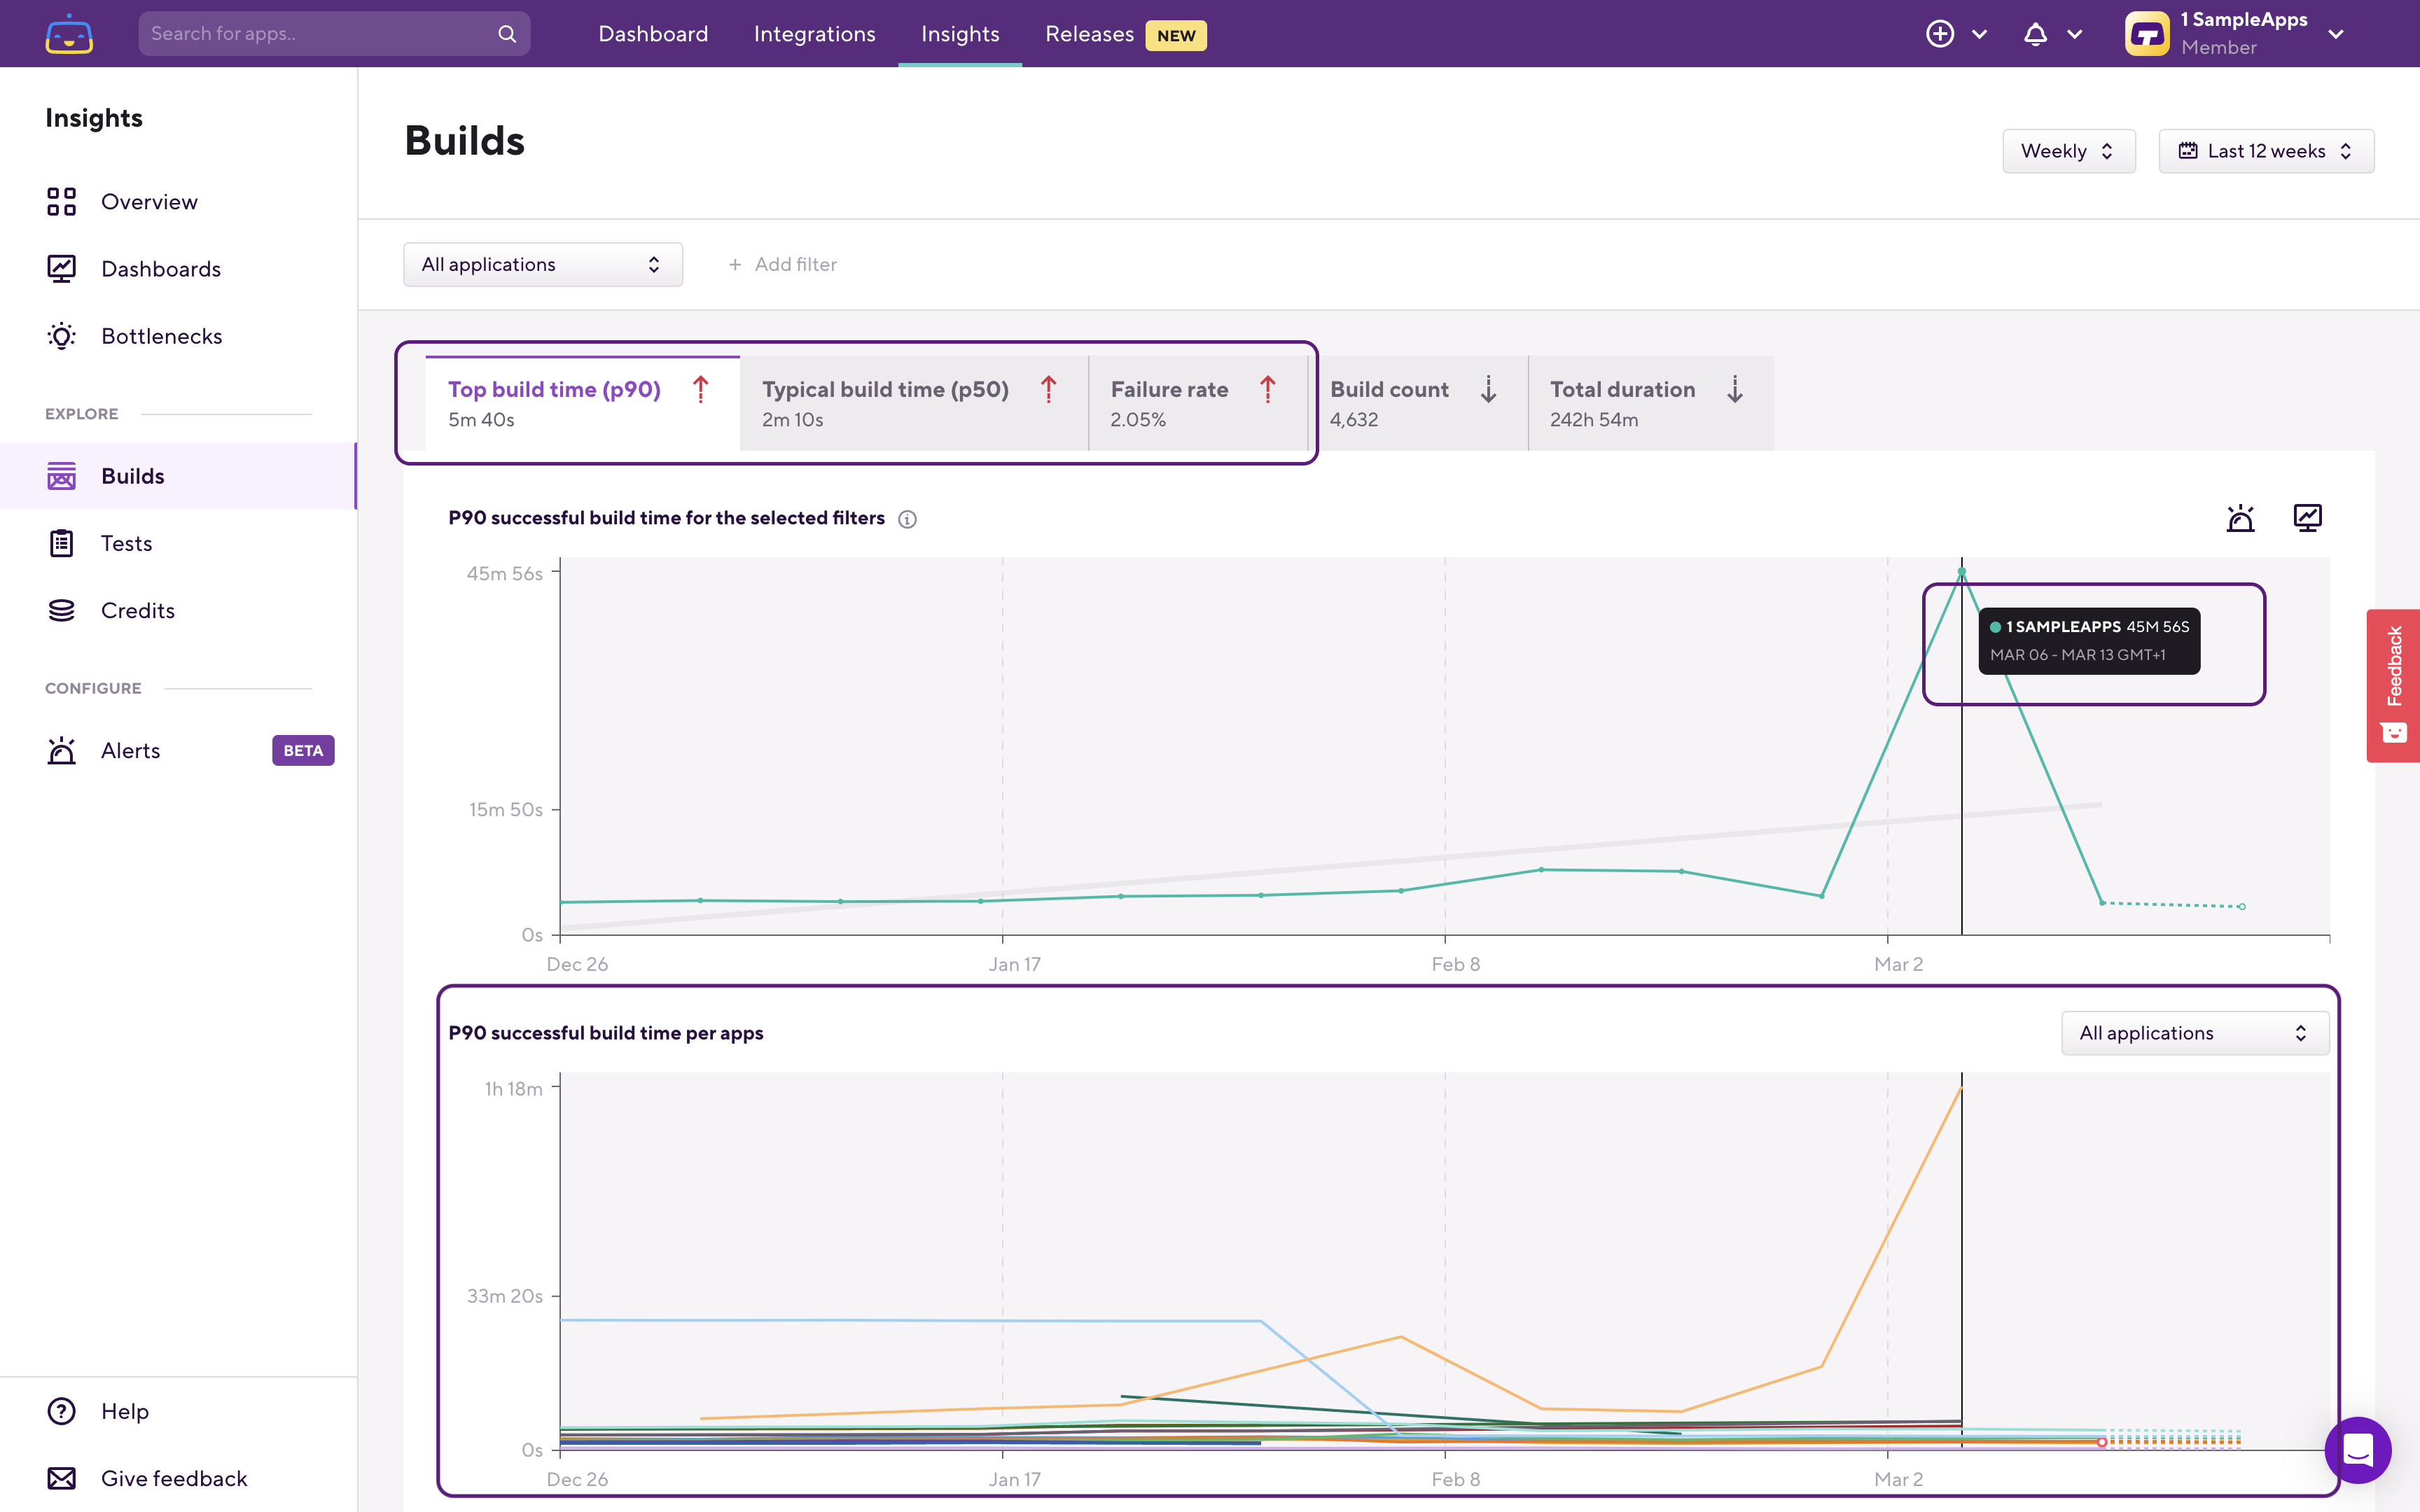
Similarly, if you filter down to a specific app, but you don’t set any other filters, the app’s aggregate build time and failure rate numbers and the charts will show you the app’s Pipeline level duration and failure rate metrics, instead of the previous Workflow level duration and failure rate metrics.

I’d like to call out a possible breaking change related to this. If you’re using Pipelines and you previously (before the introduction of Pipeline Insights) configured Build Time or Failure Rate Alerts for Workspace or for App level, you should check the threshold for these Alerts. As Build Time and Failure Rate for the Workspace and for Apps are now calculated on a Pipeline level, your previously set threshold for the App or for the Workspace might no longer be the right threshold (in the majority of cases this change in the calculation increases the build duration and the failure rate of the App and Workspace, as Pipelines run longer than its Workflows' p90 or p50 - a single stage pipeline’s duration is roughly the same as the longest workflow build in it, and a multi-stage pipeline’s duration is the sum of its Stages' duration - and fail more frequently than the average of its Workflows' failure rate - a Pipeline fails if any of the Workflows in the Pipeline fails).

That’s it. We hope you’ll enjoy these updates and the new possibilities it brings.
We’d love to know what you think about Pipeline Insights, or if you have any questions or feedback about Bitrise Insights. Please let us know using the Give feedback button in the bottom left corner of the Bitrise Insights sidebar.

Happy data digging!