
No one starts their work day thinking “Let’s investigate the memory allocations of my Gradle build”, but sometimes life happens (usually at the worst possible time):
1Exception: java.lang.OutOfMemoryError thrown from the UncaughtExceptionHandler in thread "pool-1-thread-1"Every Gradle project faces memory allocation problems eventually, as the codebase grows. So, instead of blindly applying JVM flags from Stack Overflow until it’s resolved, why not take a deeper look? (And if this happened to you at The Worst Possible Time, it’s okay to just bookmark this post and get back to it later!)
There are also free speed gains to get by configuring the right amount of memory. Even if your Gradle builds don’t fail with a memory-related exception, unnecessary memory pressure slows builds down.
In this article, we’ll give you a high-level overview of how the JVM and Gradle handles memory, then do experiments with different memory settings to find the ideal config. By the end of the article, you will understand what memory pressure looks like in Gradle builds, how it impacts build speeds, and how to repeat the experiments on your own projects to find the right settings for each.
JVM memory model
JVM, as its name implies, is a virtual machine. It manages memory automatically by allocating and garbage collecting unused allocations. The JVM manages different memory types, but the most important for us is the heap space. The heap is where dynamic allocations happen: for example, the code that loads a 10MB JPG into memory means a 10MB allocation on the heap.
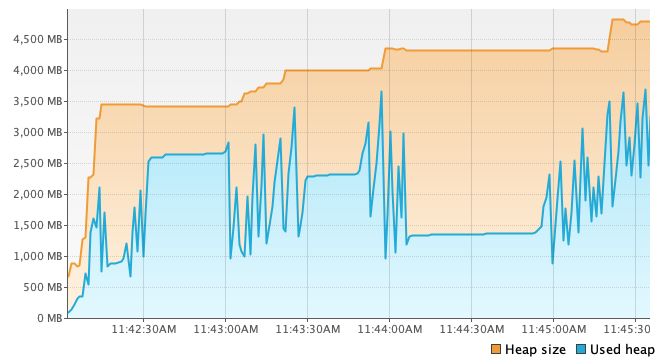
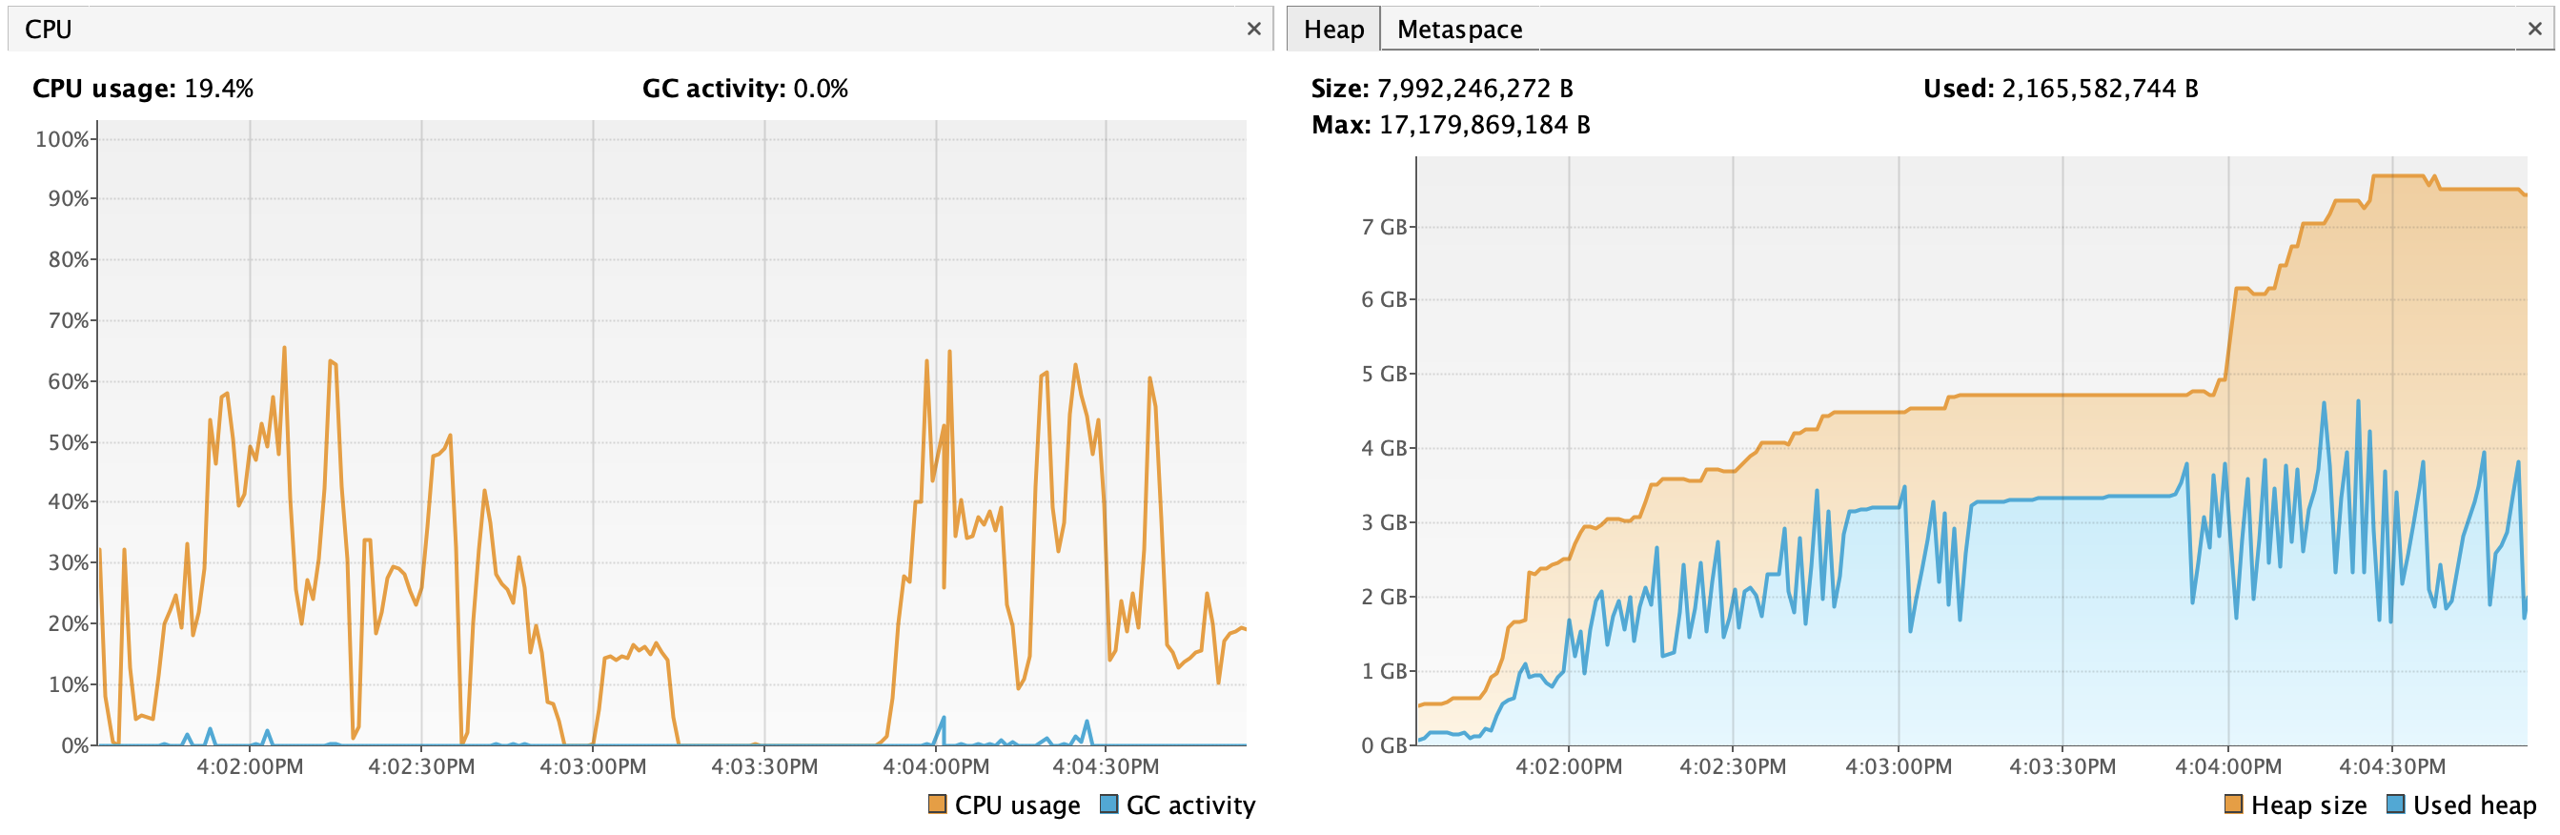
During the lifetime of a JVM process, memory usage and allocation can fluctuate a lot, but this is (normally) abstracted away from us. For example, here is a Gradle build’s memory usage over time:
The memory management can be fine-tuned with various JVM flags:
-Xms: initial heap size-Xmx: maximum heap size-XX:+UseParallelGC: JVM has multiple garbage collector (GC) algorithms with different tradeoffs. This flag allows overriding the default GC algorithm.-XX:MaxMetaspaceSize: metaspace is the memory area that stores metadata about loaded classes. By default, this is unlimited and can grow too large relative to the physical memory of the system.
It’s also important to mention the difference between the current, maximum, and used heap sizes. The JVM process requests memory from the OS, and this is reflected in the current heap size (the orange area in the graph above). But this is not always the same as what the running program uses. The actual used heap fluctuates a lot (blue area), and the JVM retains the unused heap for a while, in case it’s needed again. Finally, the maximum heap size is the upper limit set by the JVM args. When more memory is needed for any reason, the famous java.lang.OutOfMemoryError is thrown.
Garbage collectors
JVM ships with multiple GC implementations that can be swapped with the -XX flag. This is important because there are various trade-offs in memory management and our various workloads have different priorities. Consider these two:
- A build system: it runs in the background and I want it to be as fast as possible. It’s okay to use huge amounts of memory and to occasionally become unresponsive if it means faster overall execution.
- A backend service, serving thousands of requests in parallel: latency is very important, it’s unacceptable if 1% of requests are served in 20 seconds while others are served in 100 ms.
The JVM docs include a guide for selecting the right garbage collector. We won’t go into the details here, but it’s enough to mention that for Gradle-like workloads, the Parallel GC is the optimal choice. Most projects already define this setting.
Memory usage during a Gradle invocation
Next, let’s see what happens during a Gradle build and the different JVM processes that run.
In Gradle projects, the previously shown JVM flags can be defined in the gradle.properties file like so:
1org.gradle.jvmargs=-Xmx4G -Xms512M -XX:MaxMetaspaceSize=1g -XX:+UseParallelGC When you execute ./gradlew assembleDebug, the first process that starts is the Gradle Daemon (this is a simplification, but if you are interested the full picture, check out this great article), and this is the main JVM process that does most of the heavy lifting. Gradle tasks run in this JVM instance (though again, this is not always true), so it’s important to allocate enough memory to it.
Gradle uses a 512 MB max heap size (-Xmx) by default, which causes the famous out-of-memory crashes in Android projects. The Android docs also suggest increasing this limit to avoid memory-related crashes and wasted CPU cycles because of garbage collection.
There is one more JVM process in a typical Android build: the Kotlin compiler daemon. This is a separate process spawned by the first Kotlin compile task and executes all compile tasks during the Gradle invocation. By default, this JVM instance inherits the memory settings of the org.gradle.jvmargs set in gradle.properties, so we should calculate with two JVM instances when tweaking the JVM args of an Android project.
There are also other memory-hungry Gradle tasks in a typical Android project:
- Merging DEX files (the
mergeDextask) - Shrinking and obfuscation with R8 (the
transformClassesAndResourcesandshrinkResourcestasks)
Experiments
That’s enough theory to start playing with Gradle executions and profile the memory usage.
We are going to build a sample Android app while instrumenting the JVM processes with VisualVM: Home. This tool lets us observe CPU usage, GC activity and memory allocations in real time.
We’ll only test the assemble task in this article, but measuring tests and other Gradle tasks could be interesting too.
We run the benchmarks with the open-source DuckDuckGo Android project. As always, the results of benchmarking this specific project don’t necessarily mean universally true conclusions, so you should repeat the same benchmarks on your own projects.
When benchmarking local builds, these are the steps and exact commands we used:
1# Stop any running Gradle daemons
2./gradlew --stop
3
4# Run the heavy task. Ignore the cache and spawn a new daemon for the duration of the build.
5./gradlew :app:assemblePlayRelease --rerun-tasks --no-daemon
We used VisualVM to observe memory metrics during the Gradle build. These two JVM processes are interesting in particular:
- Gradle Daemon
- org.jetbrains.kotlin.daemon.KotlinCompileDaemon (this starts a bit later, at the first
compileKotlintask)
For measuring CI builds, the following Bitrise workflow was used:
1jvmargs-duckduckgo:
2  envs:
3  # Tweak JVM args here.
4  # This is used by both Gradle steps (to avoid accidentally creating two different Gradle daemons)
5  - JVMARGS: "-Xmx16G -XX:+UseParallelGC"
6  meta:
7      bitrise.io:
8      machine_type_id: g2.linux.x-large
9  steps:
10  - git-clone@8:
11      inputs:
12      - repository_url: https://github.com/duckduckgo/Android.git
13      - commit: 524e21690536cd52f24c3812023c580331a794be
14  - script@1:
15      title: Patches
16      inputs:
17      - content: sed -i 's/minifyEnabled false/minifyEnabled true/g' app/build.gradle
18  - gradle-runner@3:
19      title: Warmup
20      inputs:
21      - gradlew_path: "./gradlew"
22      - gradle_task: assemblePlayRelease
23      - gradle_options: -Dorg.gradle.jvmargs="$JVMARGS"
24  - gradle-runner@3:
25      title: Run build
26      inputs:
27      - gradlew_path: "./gradlew"
28      - gradle_task: assemblePlayRelease
29      - gradle_options: -Dorg.gradle.jvmargs="$JVMARGS" --rerun-tasks
Machine specs:
- Local: MacBook M3 Pro, 14 CPU cores, 36GB RAM
- CI: Linux Pro X Large machine type, 16 vCPU, 64GB RAM
We’ll focus on tweaking the max heap size (-Xmx) as this is (by default) set to a much lower value than the available RAM. Let’s start with a small value and see what happens when we increase this gradually.
2GB max heap
This is not enough for the minify task and the build fails:
1R8: java.lang.OutOfMemoryError: GC overhead limit exceededR8 runs in the minify task and triggers the GC overhead limit. According to the Parallel GC documentation:
If more than 98% of the total time is spent in garbage collection and less than 2% of the heap is recovered, then an OutOfMemoryError, is thrown. This feature is designed to prevent applications from running for an extended period of time while making little or no progress because the heap is too small.3GB max heap
- Local build time: 3m33s
- CI build time (median of 5): 5m26s
- GC time: 32.8s
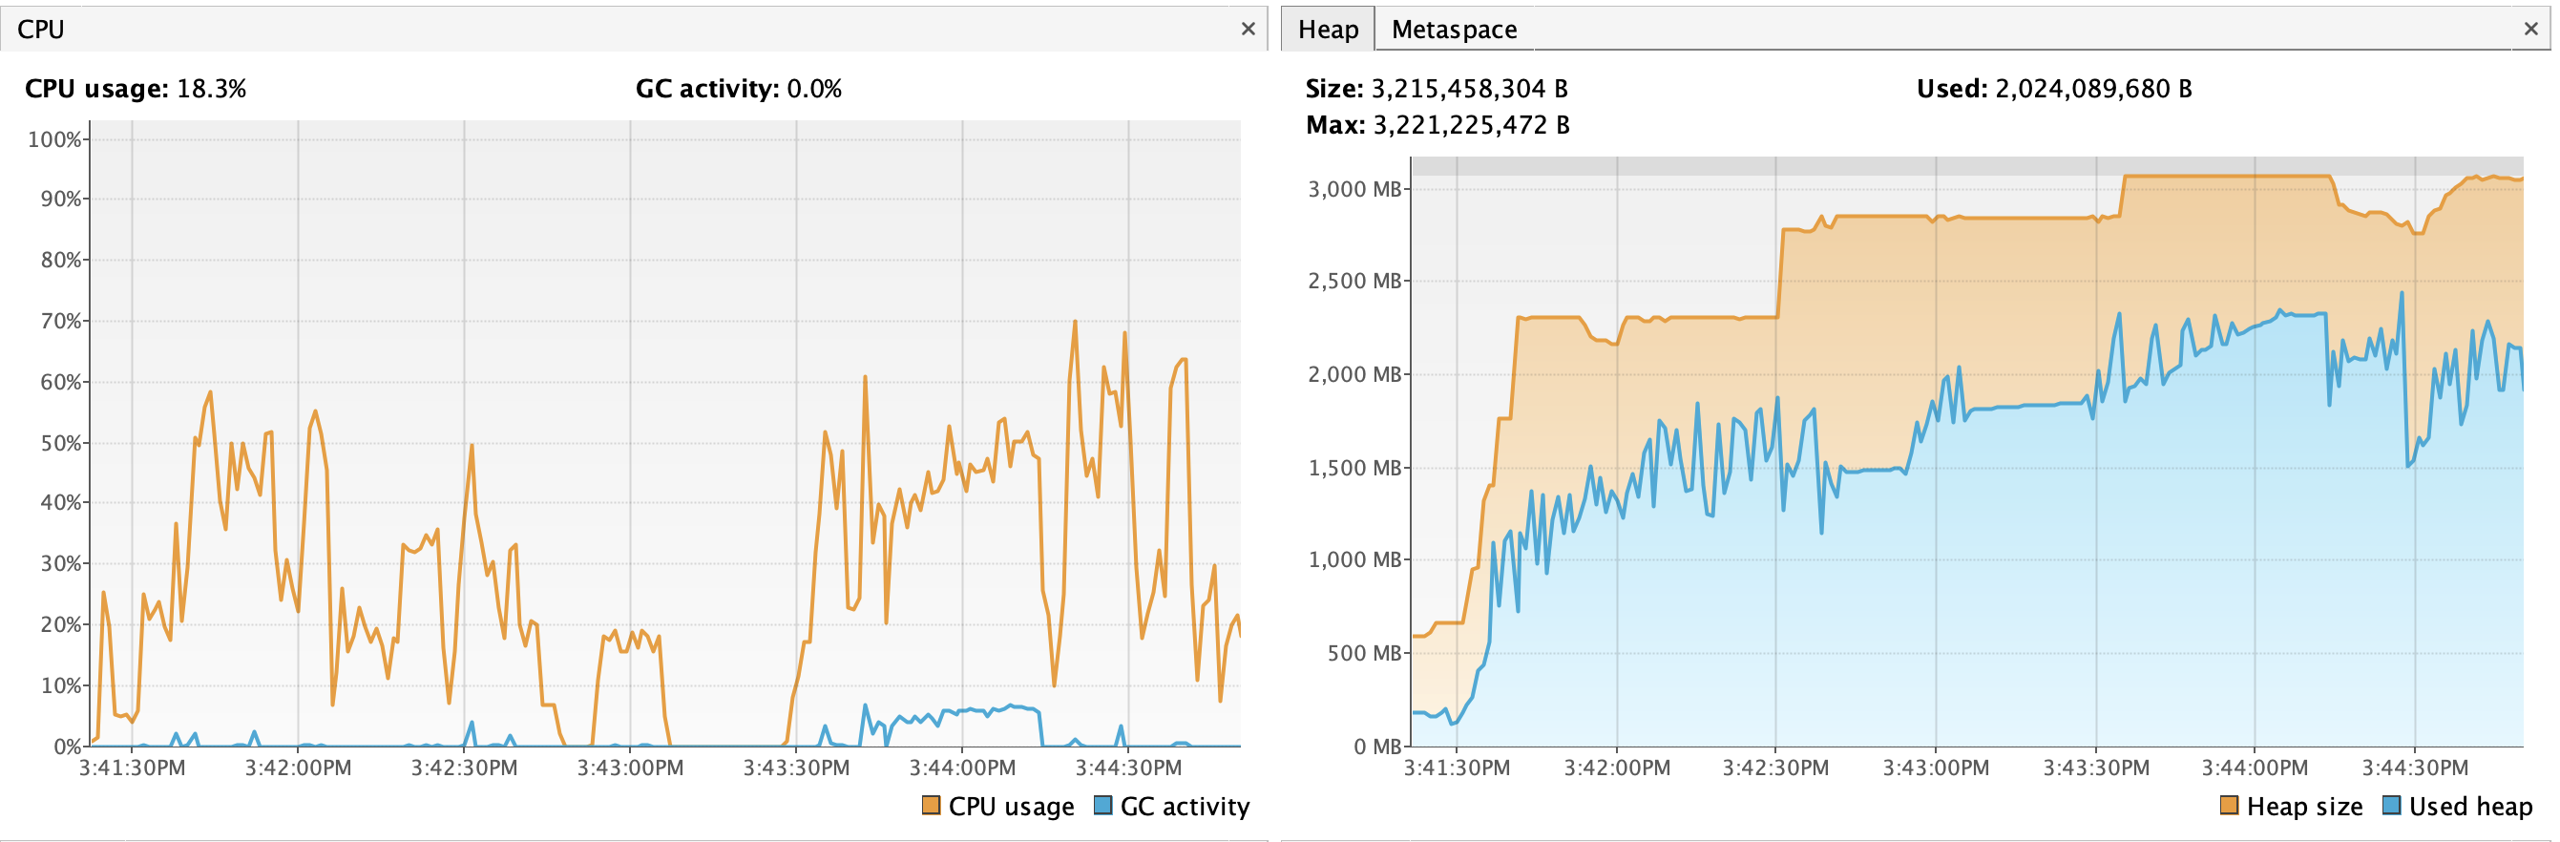
💡 Findings
- The high GC activity happens when both
minifyWithR8+lintVitaltasks are running at the same time. - We reached the maximum heap allocation two times, and the garbage collector worked hard to keep the used heap below the allocation.
- In the CI tests, the last one was abnormally long. It’s possible that the GC was barely below the overhead limit and consumed most CPU cycles.
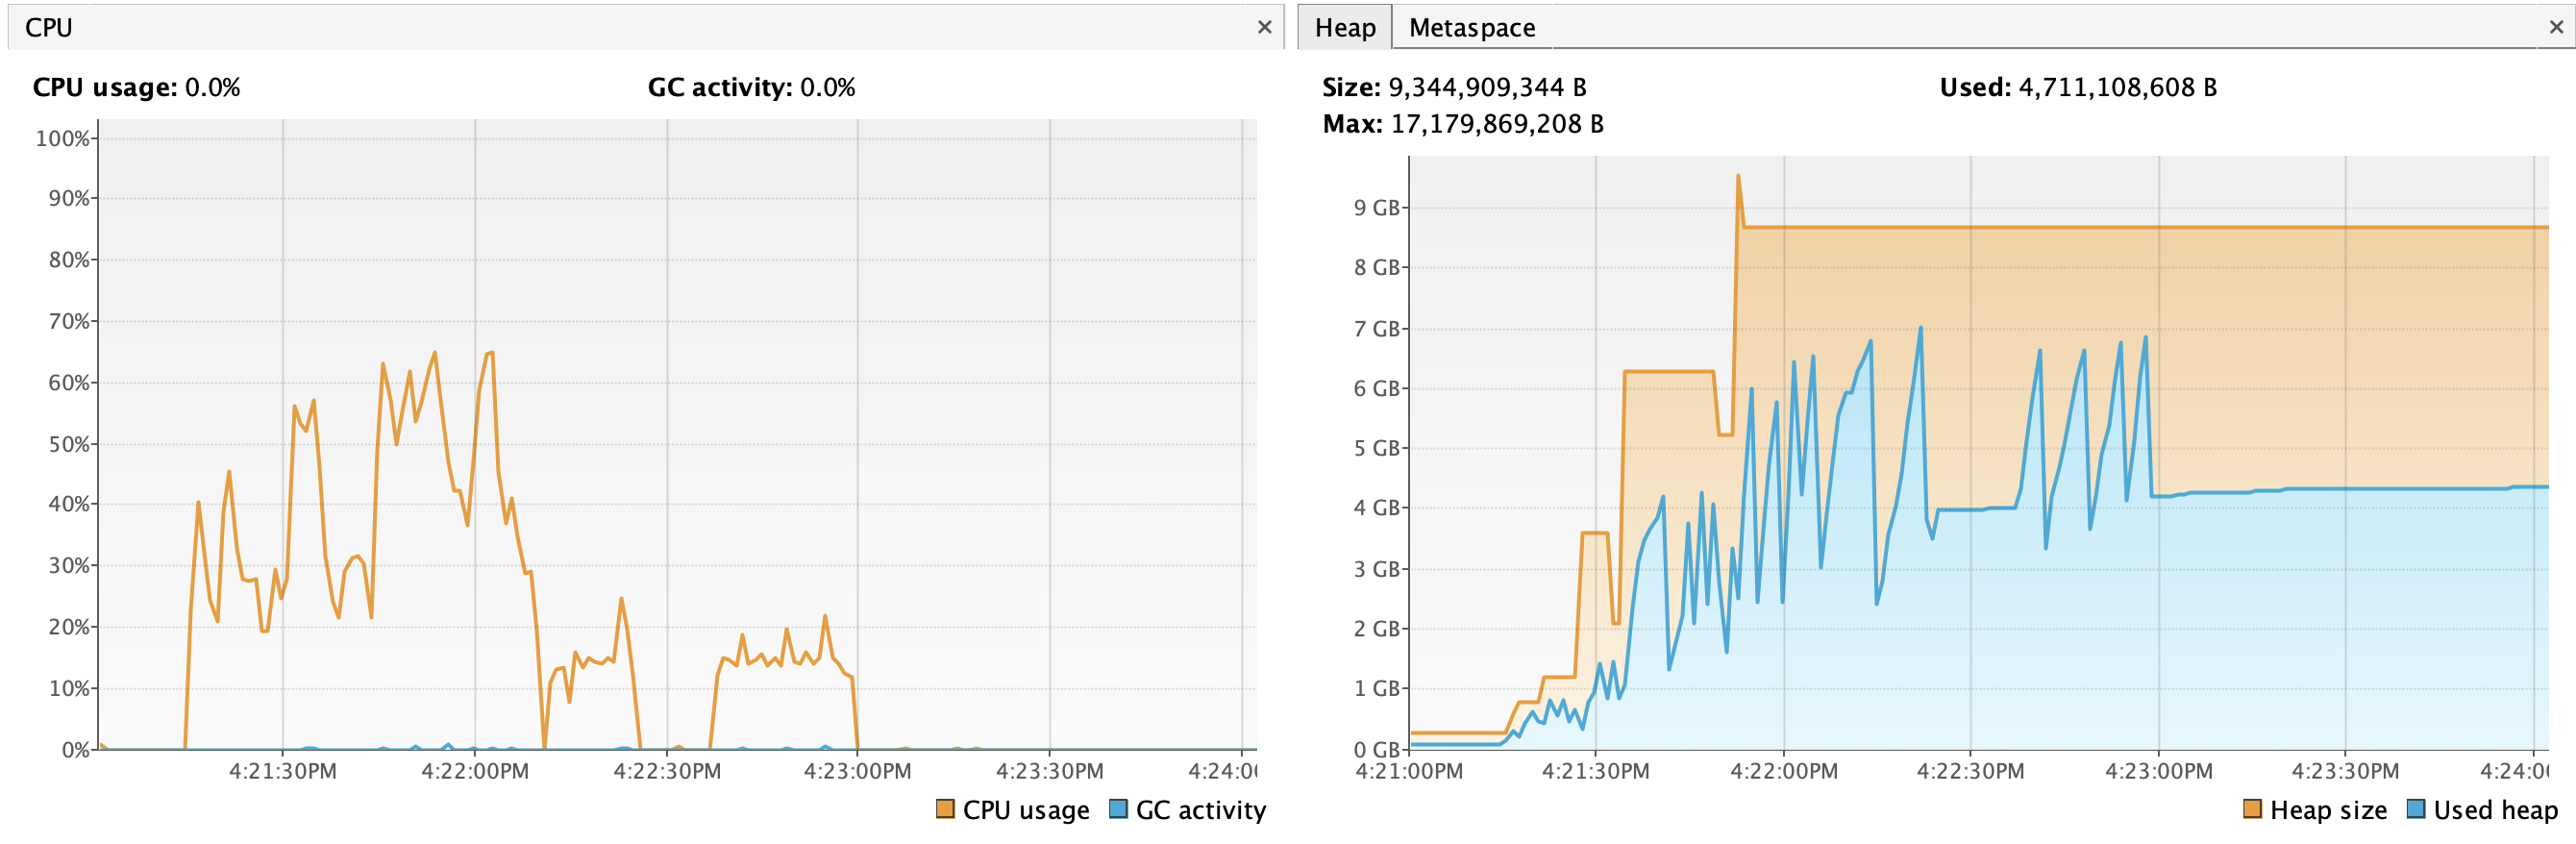
4GB max heap
- Local build time: 3m03s
- CI build time (median of 5): 3m02s
- GC time: 7.7s
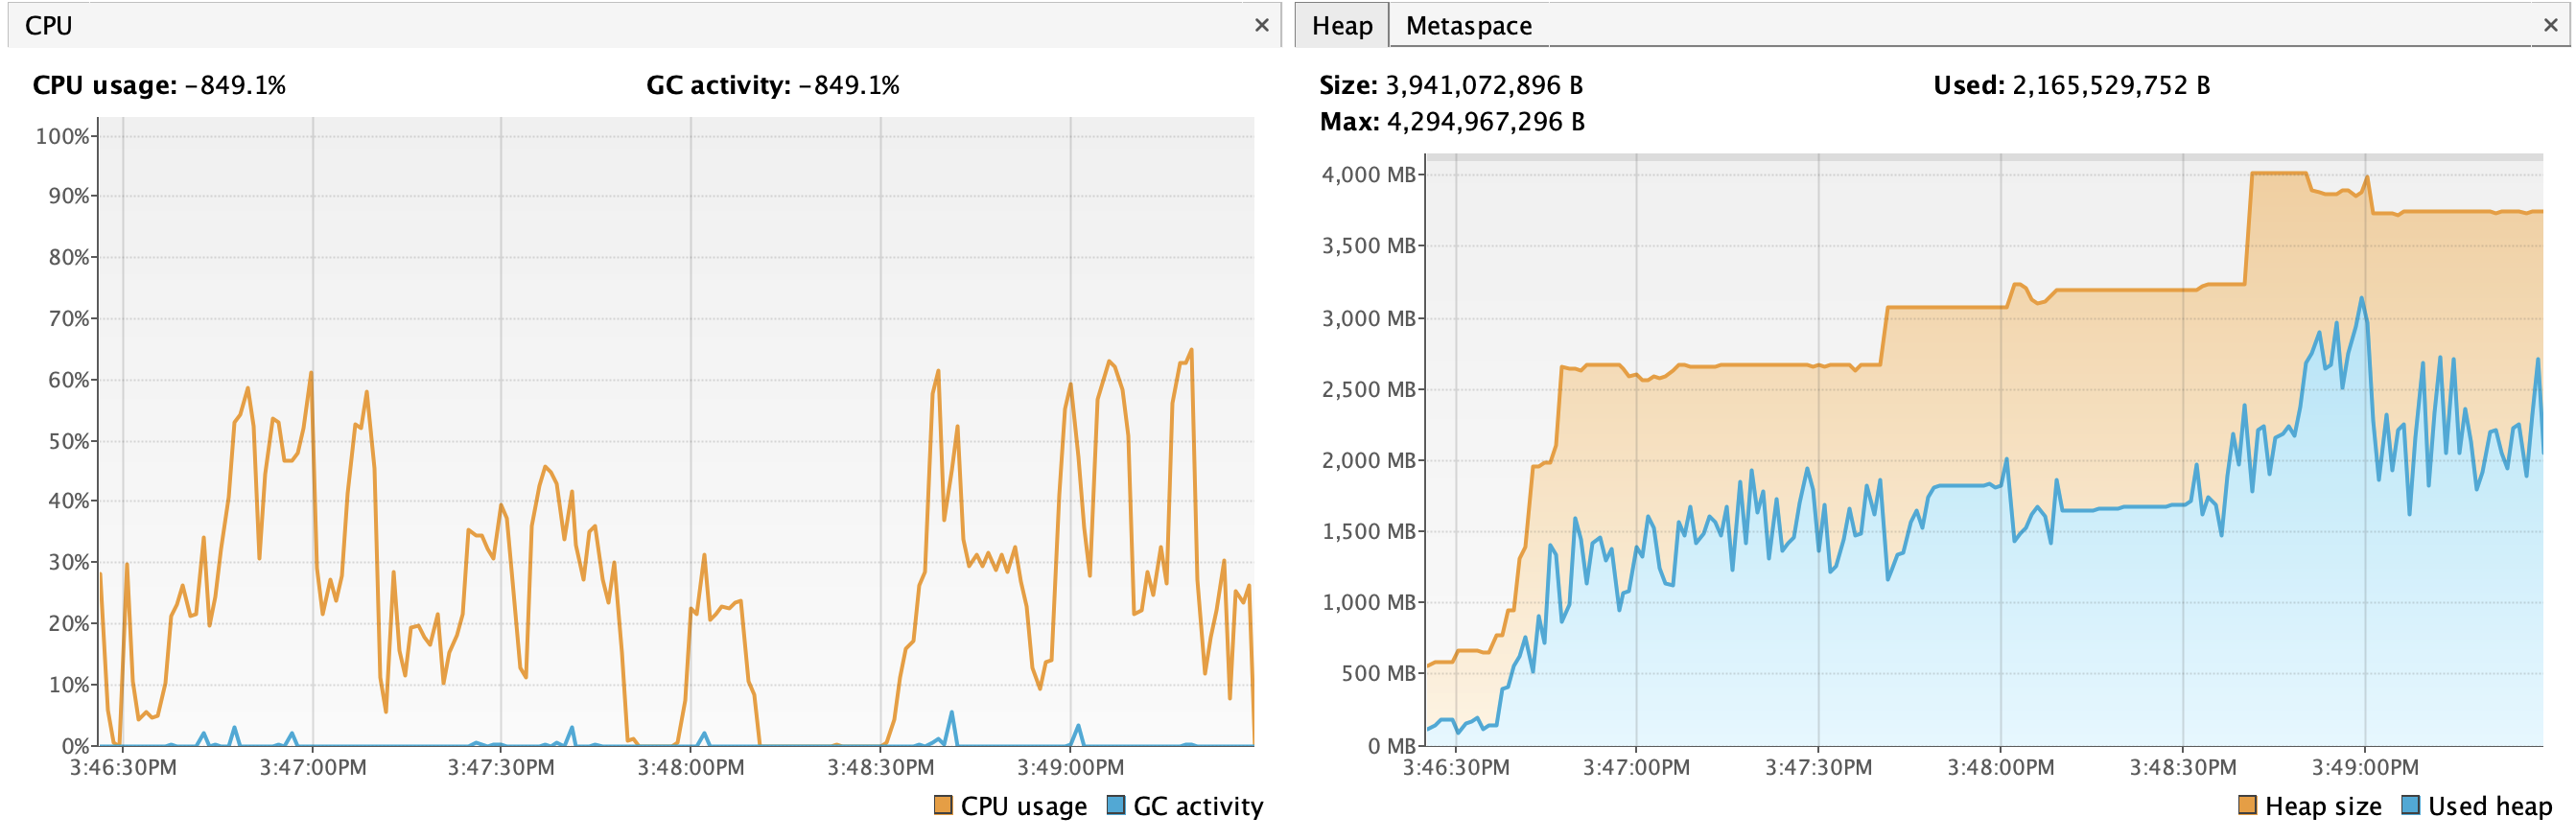
💡 Findings
- With +1GB of heap, the constant GC thrashing is gone, there are only spikes of GC activity. GC time is 1/4th of the previous run, which is a nice improvement.
- Local build times slightly improved, but CI build times are almost 2x faster.
- Heap usage now reached 3GB (the previous allocation limit), and the heap allocation reached the 4GB limit for a short time.
8GB max heap
- Local build time: 3m02s
- CI build times (median of 5): 3m06s
- GC time: 7.5s
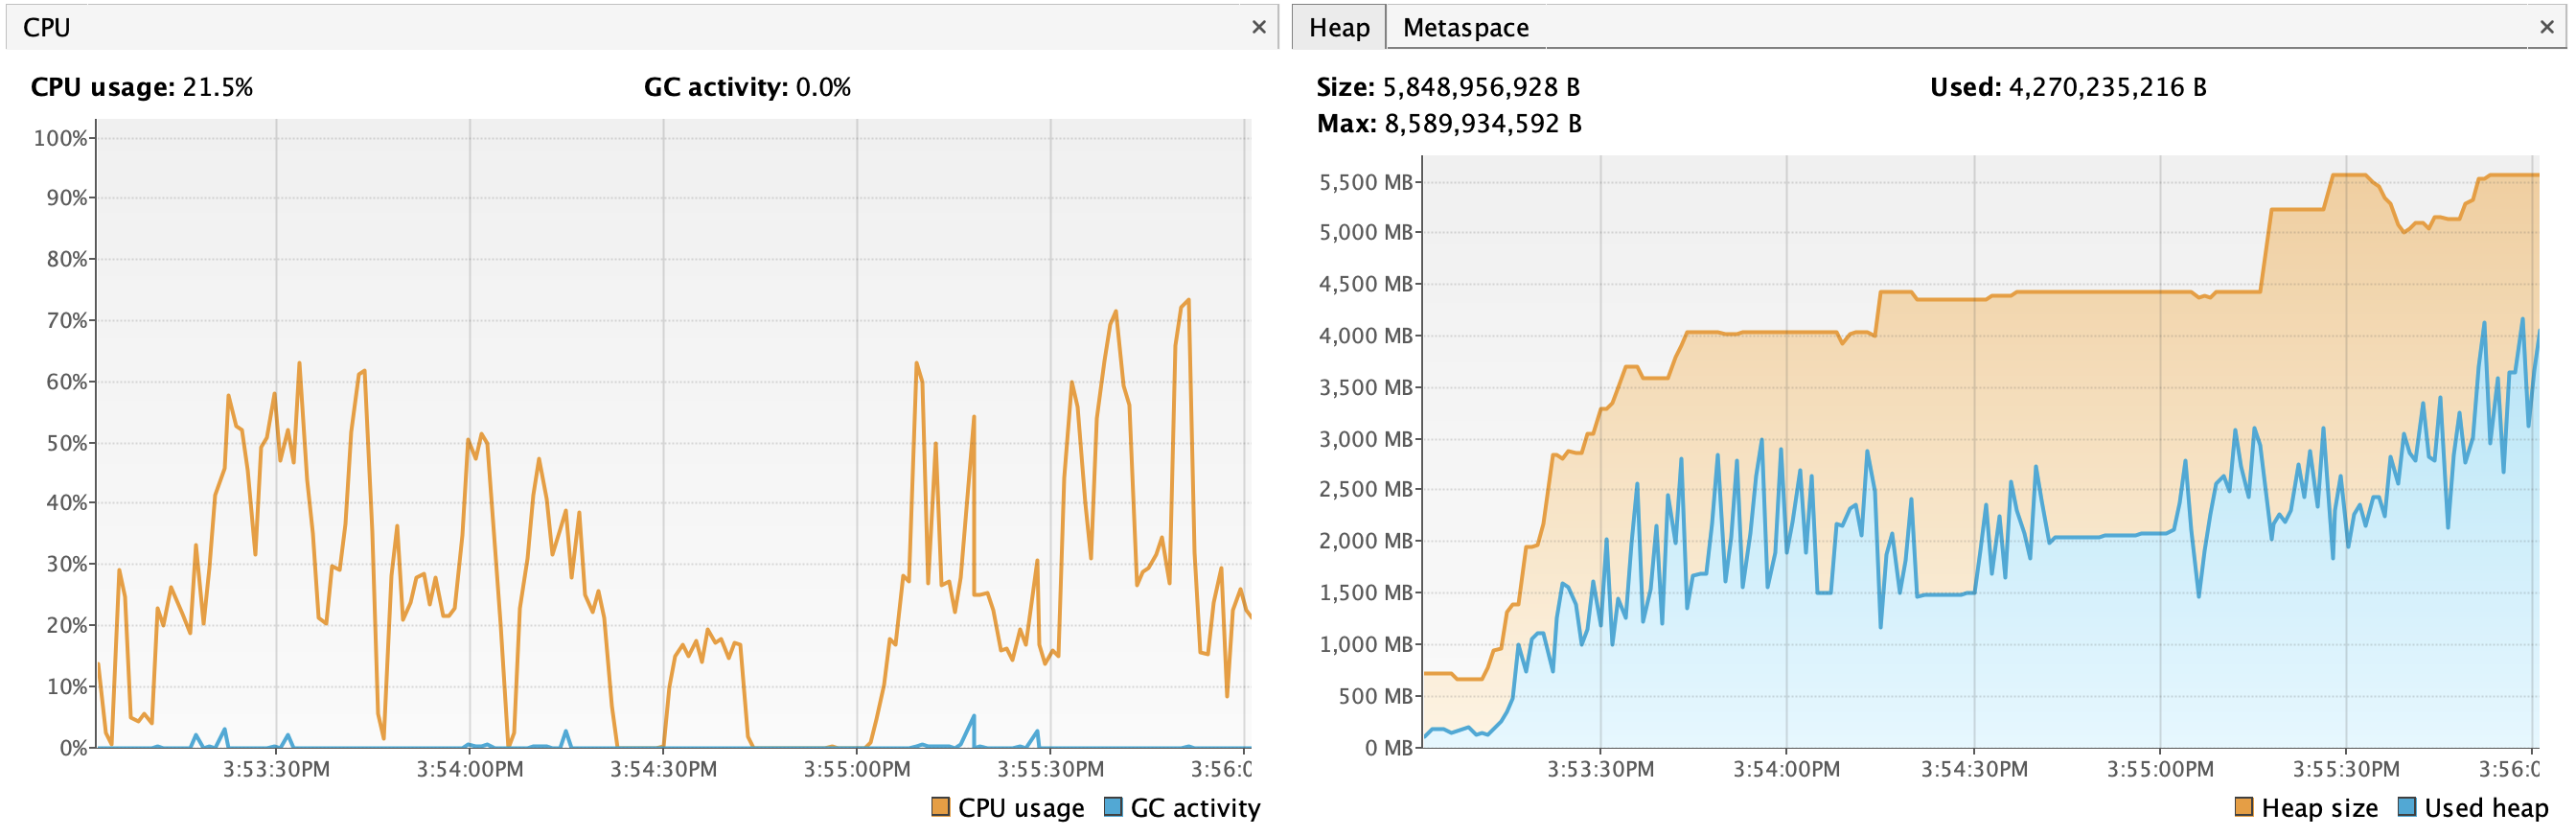
💡 Findings
- Doubling the heap limit has a minimal effect on GC time and the overall build time. There are still some GC spikes.
- JVM decided to allocate more heap and to garbage-collect less memory, especially towards the end of the build.
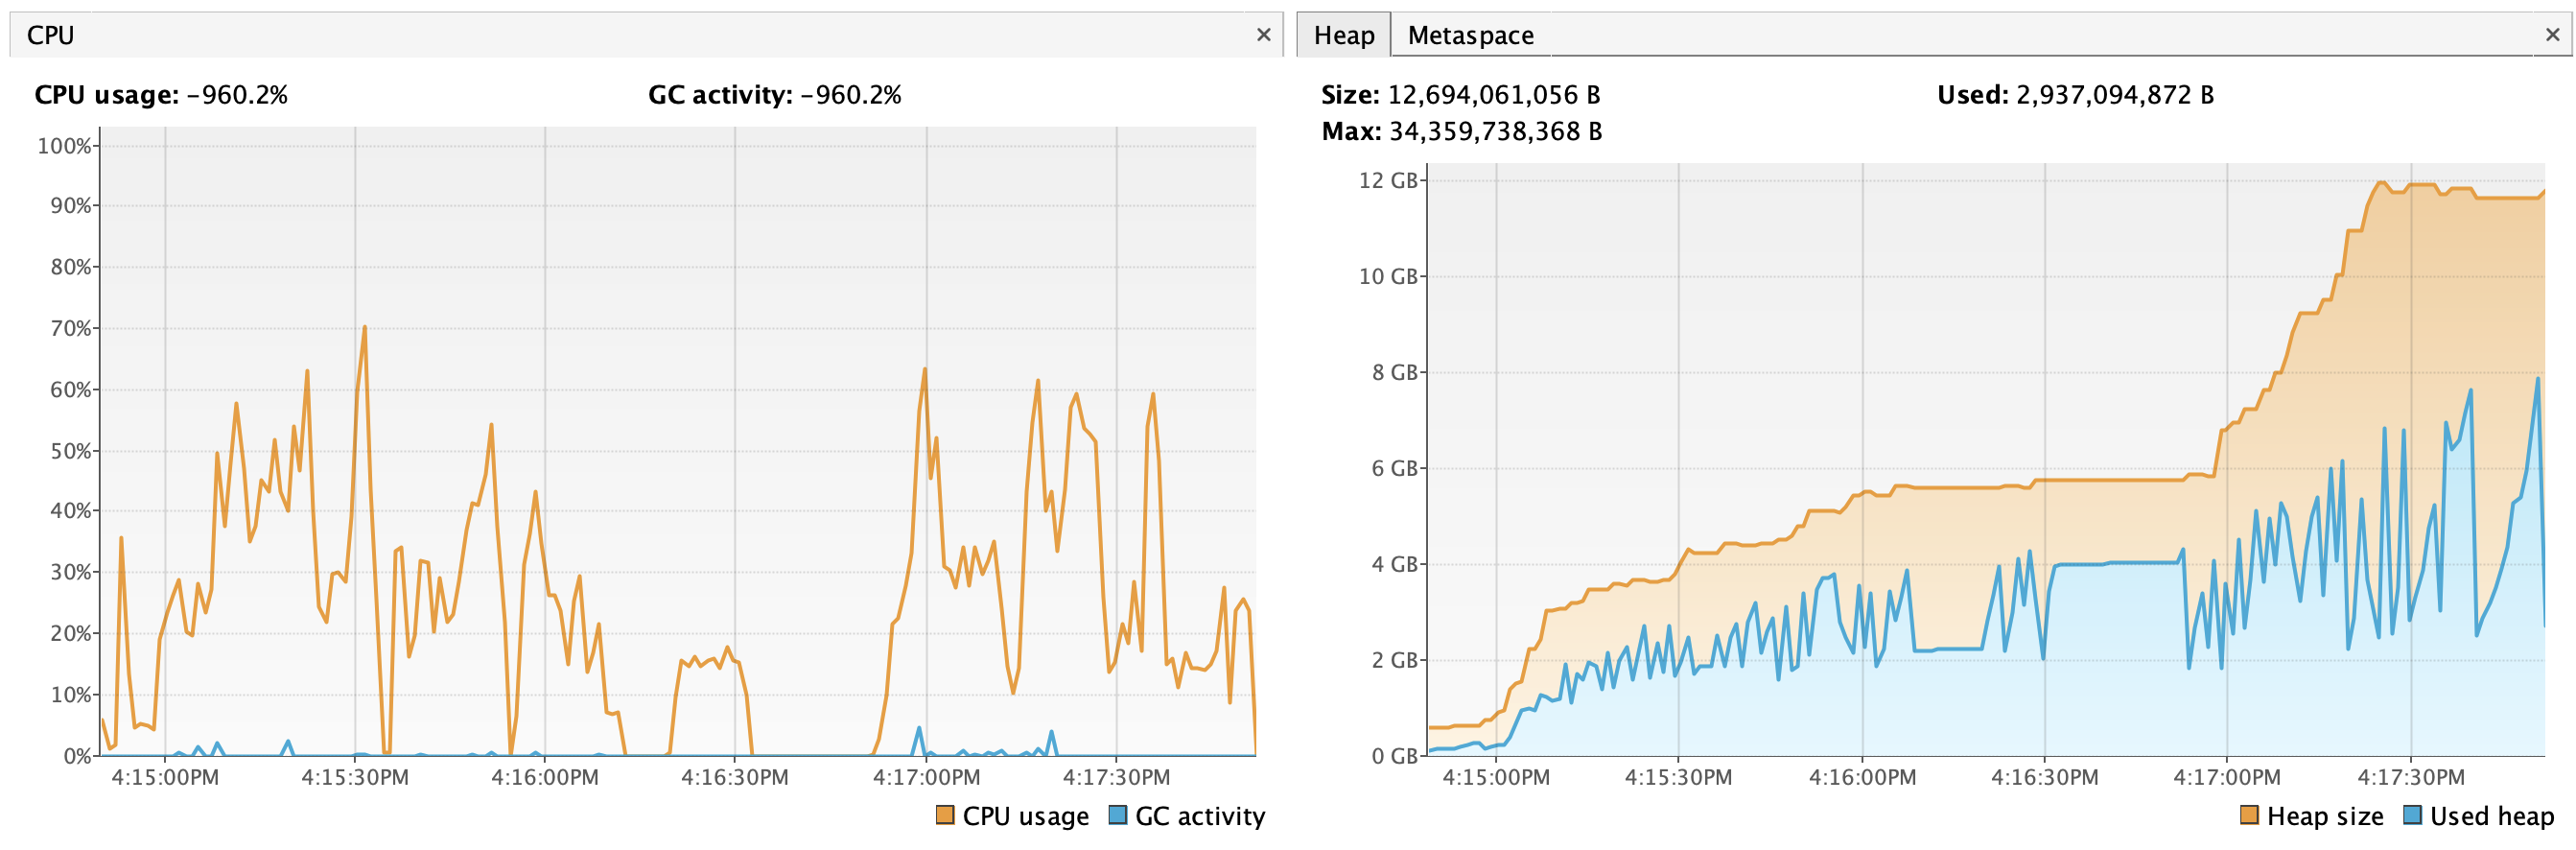
16GB max heap
- Local build time: 3m07s
- CI build times (median of 5): 3m03s
- GC time: 6.2s
💡 Findings
- The high GC activity happens when both
minifyWithR8+lintVitaltasks are running at the same time. - We reached the maximum heap allocation two times, and the garbage collector worked hard to keep the used heap below the allocation.
- In the CI tests, the last one was abnormally long. It’s possible that the GC was barely below the overhead limit and consumed most CPU cycles.
32GB max heap
- Local build time: 3m06s
- CI build times (median of 5): 3m04s
- GC time: 5.7s
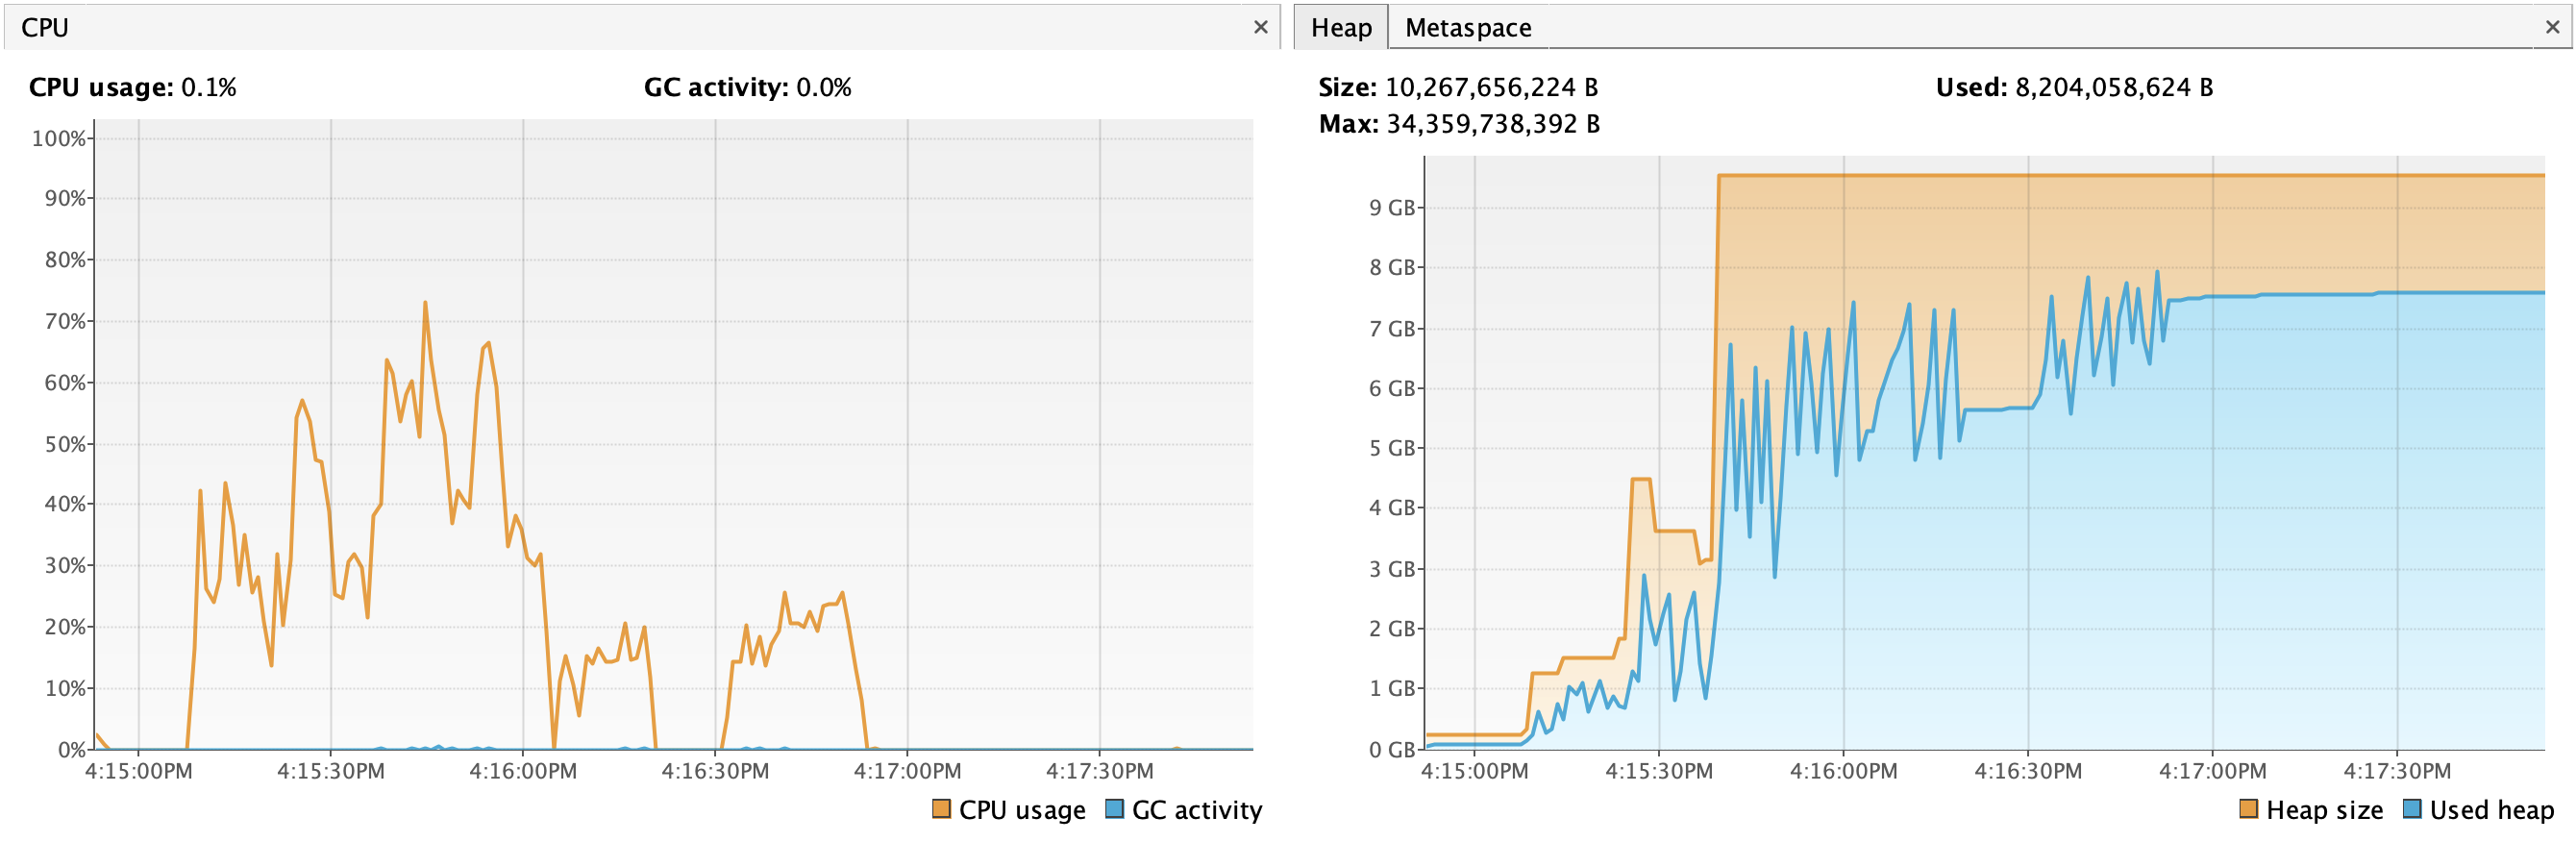
💡 Findings
- There are no further build time optimizations, even though the GC time slightly decreased again.
- The Kotlin daemon started using a lot more heap, even when it’s idle. This might be irrelevant in CI workflows where nothing else happens after the Gradle invocation, but this puts memory pressure on a local dev machine where lots of other processes also need memory.
- At this point, the small reduction in GC time is “eaten” by the increased OS-level memory pressure (and swapping), and JVM having to garbage-collect a larger heap.
Summary and conclusion
In summary, this is how build times relate to heap size for the DuckDuckGo project:
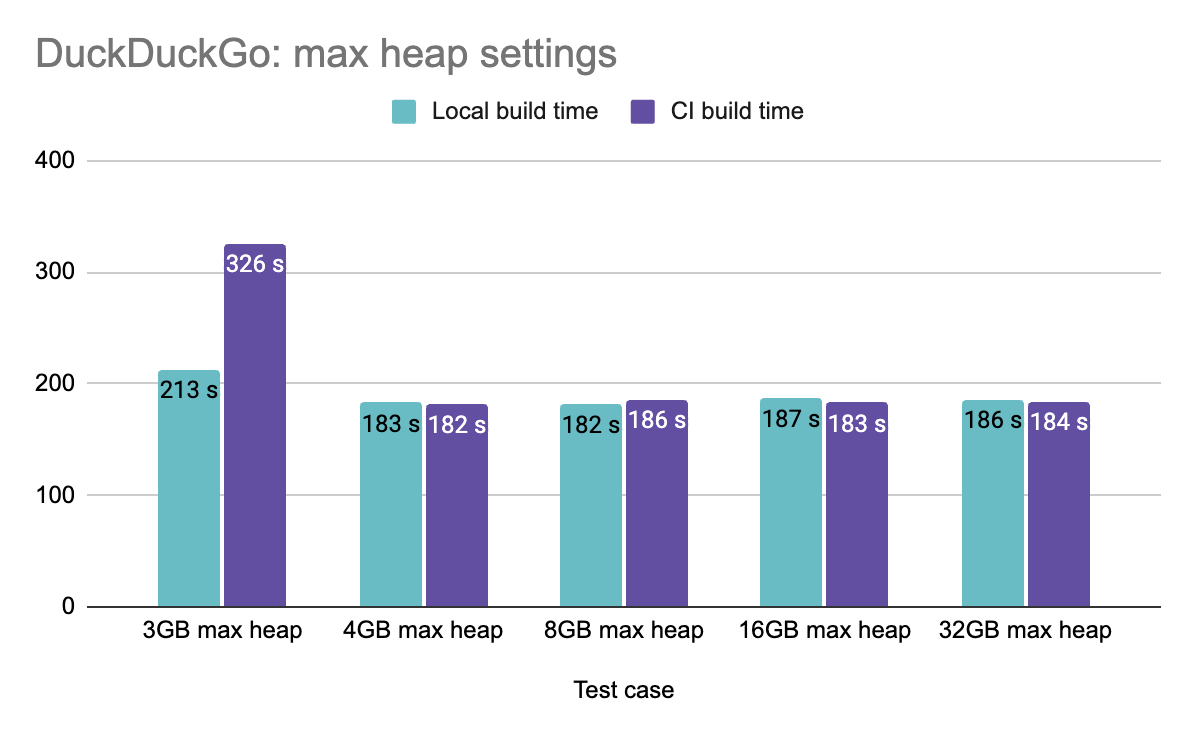
In conclusion, we have seen that the JVM memory settings sometimes need to be tweaked and there is no single best config for every use case. The most common issue is when Gradle runs out of memory and crashes the build. But beyond this scenario, build speed suffers a lot when there is just enough memory not to crash. We measured almost a 2x speedup when Gradle was given enough memory and could avoid excessive garbage-collection.
Every project is different, and you might get slightly different results and memory requirements. We encourage you to spend some time finding the right memory settings with your own project, making your builds faster for both CI and the local environment. This knowledge can also influence which Linux machine type to select for Gradle builds, bearing in mind that CPU core count is also an important factor).