Stop guessing why your Gradle builds are slow
Every Android developer has been there: yesterday's build finished in 2 minutes, but today's identical build takes 8 minutes. You check your code - nothing major changed. You check your environment - everything looks the same. So why the massive difference?
Without visibility into what actually changed between builds, debugging performance issues becomes guesswork. You're left wondering: Which tasks didn't come from cache? What inputs changed? Why did this specific compilation task take so long?
Introducing the Task Inputs visibility tab
We're excited to announce a new Task Inputs tab in Bitrise Build Cache for Gradle, giving you complete visibility into your task execution details. Now you can see exactly what's happening inside your builds - no more guessing, no more hours lost to investigation.
By showing the top slowest non-cached tasks and their inputs/outputs, this feature helps you uncover what's causing cache key changes that lead to cache misses. It can also reveal bugs in your task configuration, like incorrect module source directories or misconfigured input files. Whether you're investigating a sudden slowdown or optimizing your build configuration, you'll have the specific data you need at your fingertips.
Task Inputs in the Details tab
The new Task Inputs tab focuses on the top slowest, high-impact tasks in your build. For each task, you get comprehensive information:
Task Overview
- Task name and execution time (for example, app:compileForoDebugKotlin at 6.3s)
- Task class (like org.jetbrains.kotlin.gradle.tasks.KotlinCompile_Decorated)
- Cacheable status - know immediately if a slow task even supports caching
- Execution result and reason - understand why the task ran (requires enabling execution reason diagnostics)
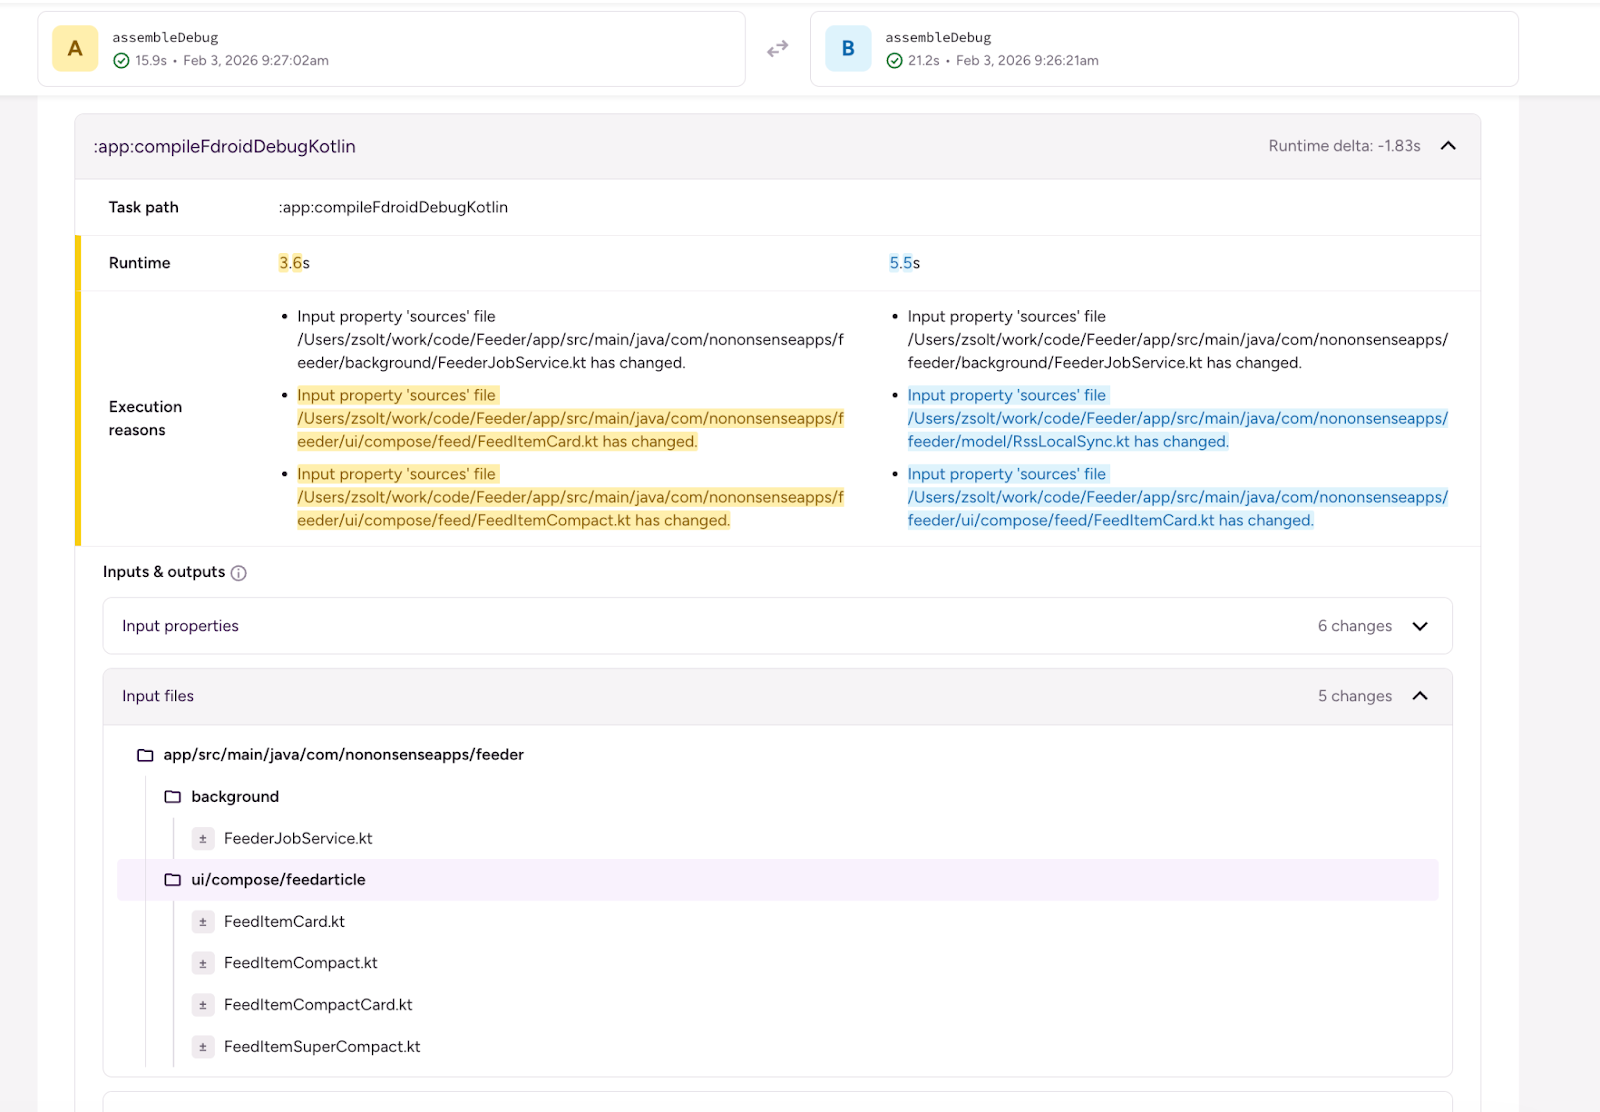
Input properties expand any task to see all its input properties and their current values. See compiler options, plugin configurations, toolchain versions, and more. This level of detail helps you identify exactly what changed between invocations.
Input and Output files browse hierarchical tree views of all input and output files for each task. See generated files, source directories, compiled classes, and JAR files - everything that went into and came out of the task execution. When files are numerous, pagination keeps the view manageable while ensuring nothing is hidden.
Filtering and Search Filter tasks by cacheability status and use the search bar to quickly find specific tasks. Spend less time scrolling, more time investigating.
Task Inputs comparison: where the real power lies
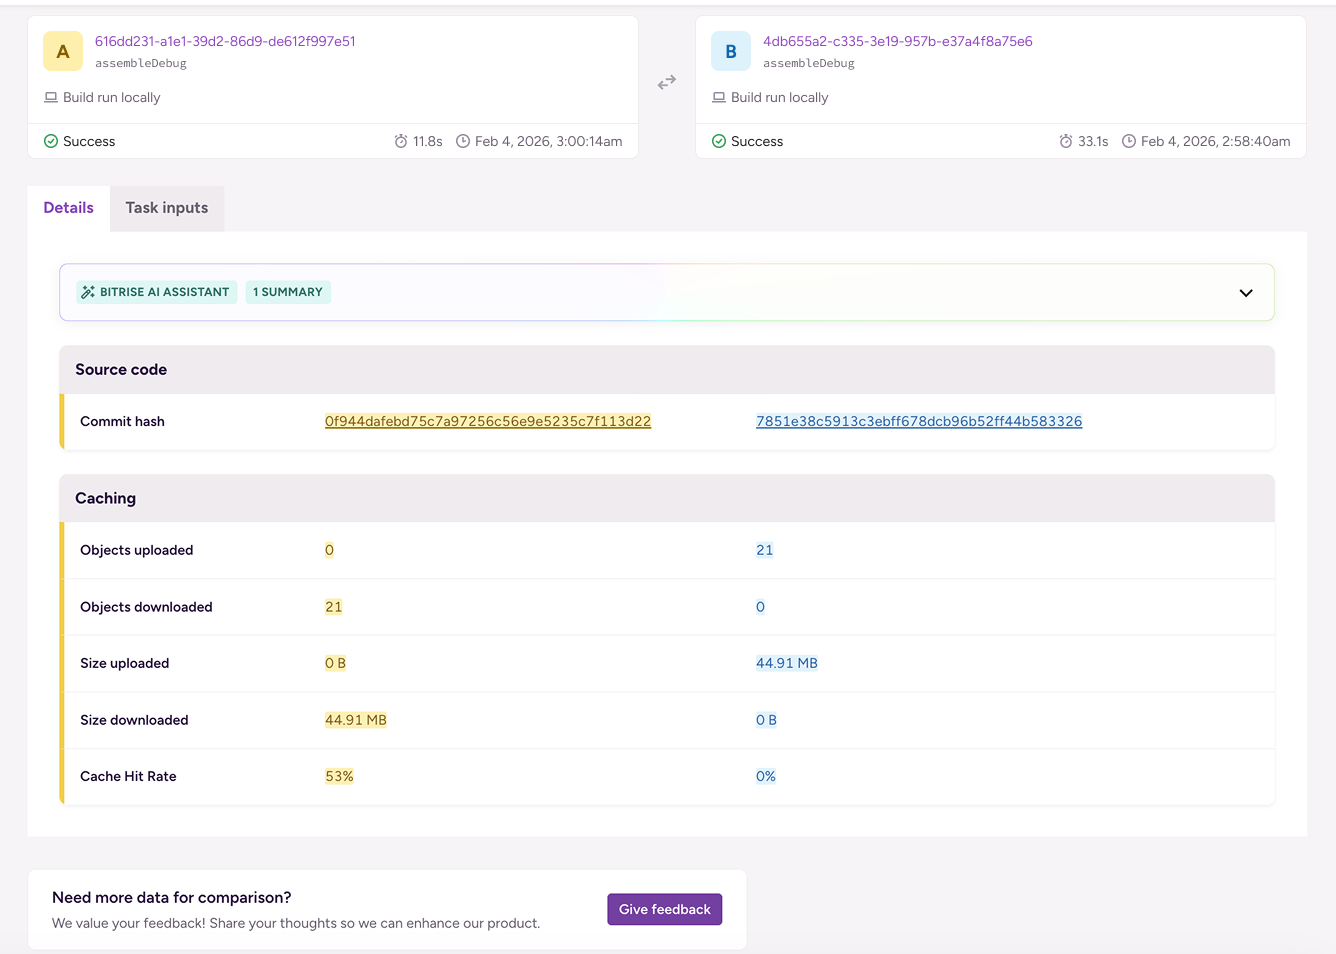
While the Task Inputs tab gives you great detail into a single invocation, the Compare page is where you'll get the most value. When investigating performance regressions or cache misses, the ability to compare task inputs between two invocations is game-changing.
How to access Compare:
- From any invocation detail page, click the Compare button at the top.
- Or from the Invocations list page, click the Compare button on the right side above the invocations list.
On the Compare page, you can:
- See task-level differences between any two invocations side-by-side.
- Identify which specific input properties changed causing cache key invalidation.
- Spot configuration bugs by comparing expected vs. actual task inputs across builds.
- Pinpoint the root cause of cache misses and performance degradations in minutes instead of hours.
This comparison view is especially powerful when debugging why a task that should have been cached ended up executing. You can instantly see that a compiler flag changed, a toolchain version was updated, or a similar change affected the task's input - all the details that explain the cache miss.
The Compare page also features AI-generated summaries that highlight key differences between invocations, making it even faster to identify what changed.
Real-world use cases
Debug performance regressions
When a build suddenly slows down, compare it to a previous fast build. Drill into each slow task to see which input properties or files changed. Maybe a dependency version bumped, or a compiler flag was modified - now you'll know immediately instead of spending hours investigating.
Understand cache misses
A task that should be cached is executing instead. With complete input visibility, you can identify the culprit: Was it a timestamp in a generated file? An environment variable in the task inputs? A configuration change you didn't realize would impact caching?
Optimize your build configuration
Make data-driven decisions about your build setup. See which plugin options are impacting which tasks, understand the full dependency tree for compilation tasks, and identify opportunities to improve cacheability across your project.
Get started today
The Task Inputs visibility feature is available now for all Bitrise Build Cache users. Simply navigate to any Gradle invocation and click the new Task Inputs tab - it appears right alongside Critical path, Uploads & Downloads, Environment, and Gradle tabs.
Start exploring your builds in detail and take control of your Android build performance. No more guessing, no more mystery slowdowns - just clear, actionable insights into exactly what's happening in your Gradle builds.
Ready to dive in? Try Bitrise Build Cache free or check out the documentation to learn more.
