
Build Cache can meaningfully shorten CI feedback loops, but only if it’s connected to workflows where it’ll actually make a difference. So how do you figure out which workflows will benefit? That’s the part that’s been easy to get wrong — until now.
Quick Connect is a new feature that takes the guesswork out of estimating time savings: it looks at your last 30 days of build data and surfaces the workflows that will benefit the most from caching. You connect those ones, skip the ones that won’t move the needle, and start seeing results faster.
The savings estimates shown are based on your own builds, not made-up numbers. They’re calculated from your actual workflow composition and compared against real data from similar projects. So while they’re predictions rather than guarantees, they reflect what your specific workflows are actually doing.
Why we needed a better way to predict savings
Build Cache performance is not one-size-fits-all. Two workflows in the same project can have very different outcomes.
A workflow heavy on compilation can often see substantial gains, since a large part of that work is reusable. A workflow focused on running tests is a different story: Build Cache can help with the compilation phase before tests run, but it can’t speed up test execution itself. If you connect the wrong workflow first, you might conclude Build Cache isn’t working for your project, when really it was just targeting the wrong problem.
Quick Connect helps you avoid that by pointing you toward the highest-impact workflows before you commit.
How the predictions are calculated
Quick Connect doesn't just spit out estimates based on a single benchmark. Here’s what’s actually going on under the hood.
Step 1: Establishing a baseline
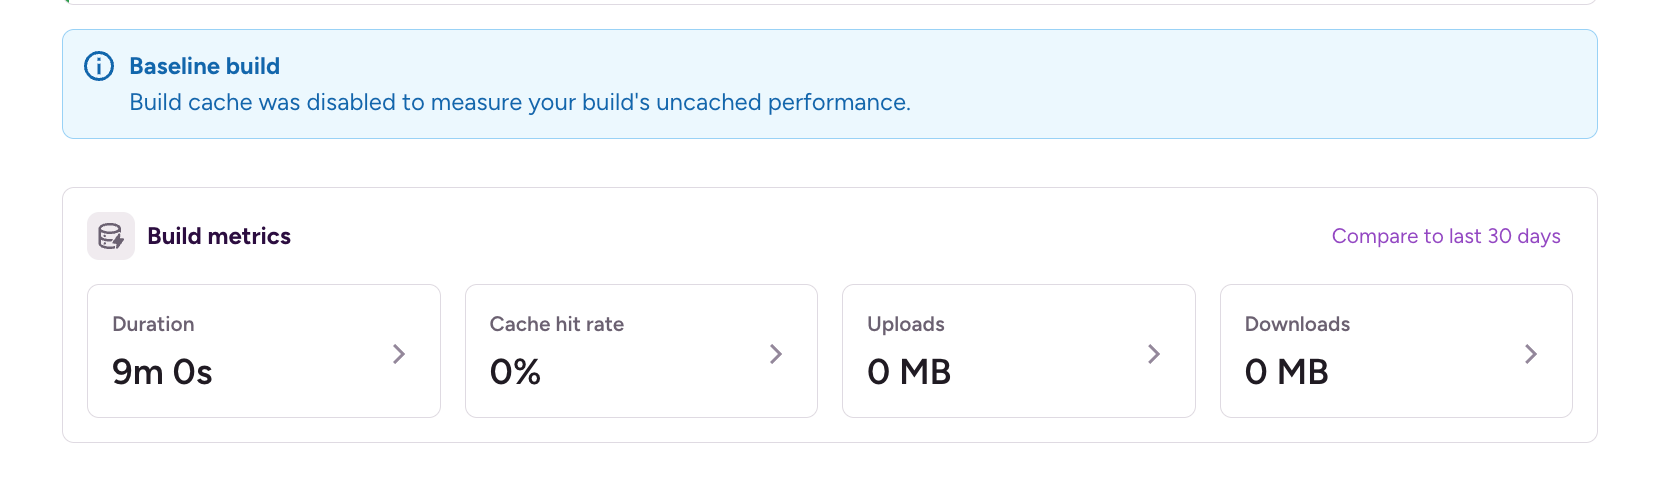
For each new Build Cache connection, we run a baseline benchmark phase: one clean build with Build Cache disabled but analytics on. This gives us a reference point for how long that workflow takes without caching involved. Later runs with a warmed cache are then compared against that baseline, giving us a real, workflow-specific signal rather than a generic number.

Step 2. Grouping commands into buckets
After analyzing roughly 1.5 million invocations across hundreds of apps and more than a thousand workflows, we identified a set of command-level buckets for Gradle and Xcode, along with the average savings for each:
The spread here tells the real story: workflow composition matters a lot. A compile-heavy workflow and a test-heavy workflow can have dramatically different outcomes even within the same project.
Step 3. Classifying your workflows
The final step is mapping your actual workflows to those buckets — before you’ve enabled Build Cache at all. For dedicated Gradle or Xcode steps, this is straightforward. For more advanced workflows (custom scripts, generic runners, Bash-wrapped Gradle invocations), we go deeper: inspecting step inputs and parsing script contents to classify what’s actually being run.
That classification is what makes the savings estimate specific to your workflows rather than a generic average.
Using Quick connect
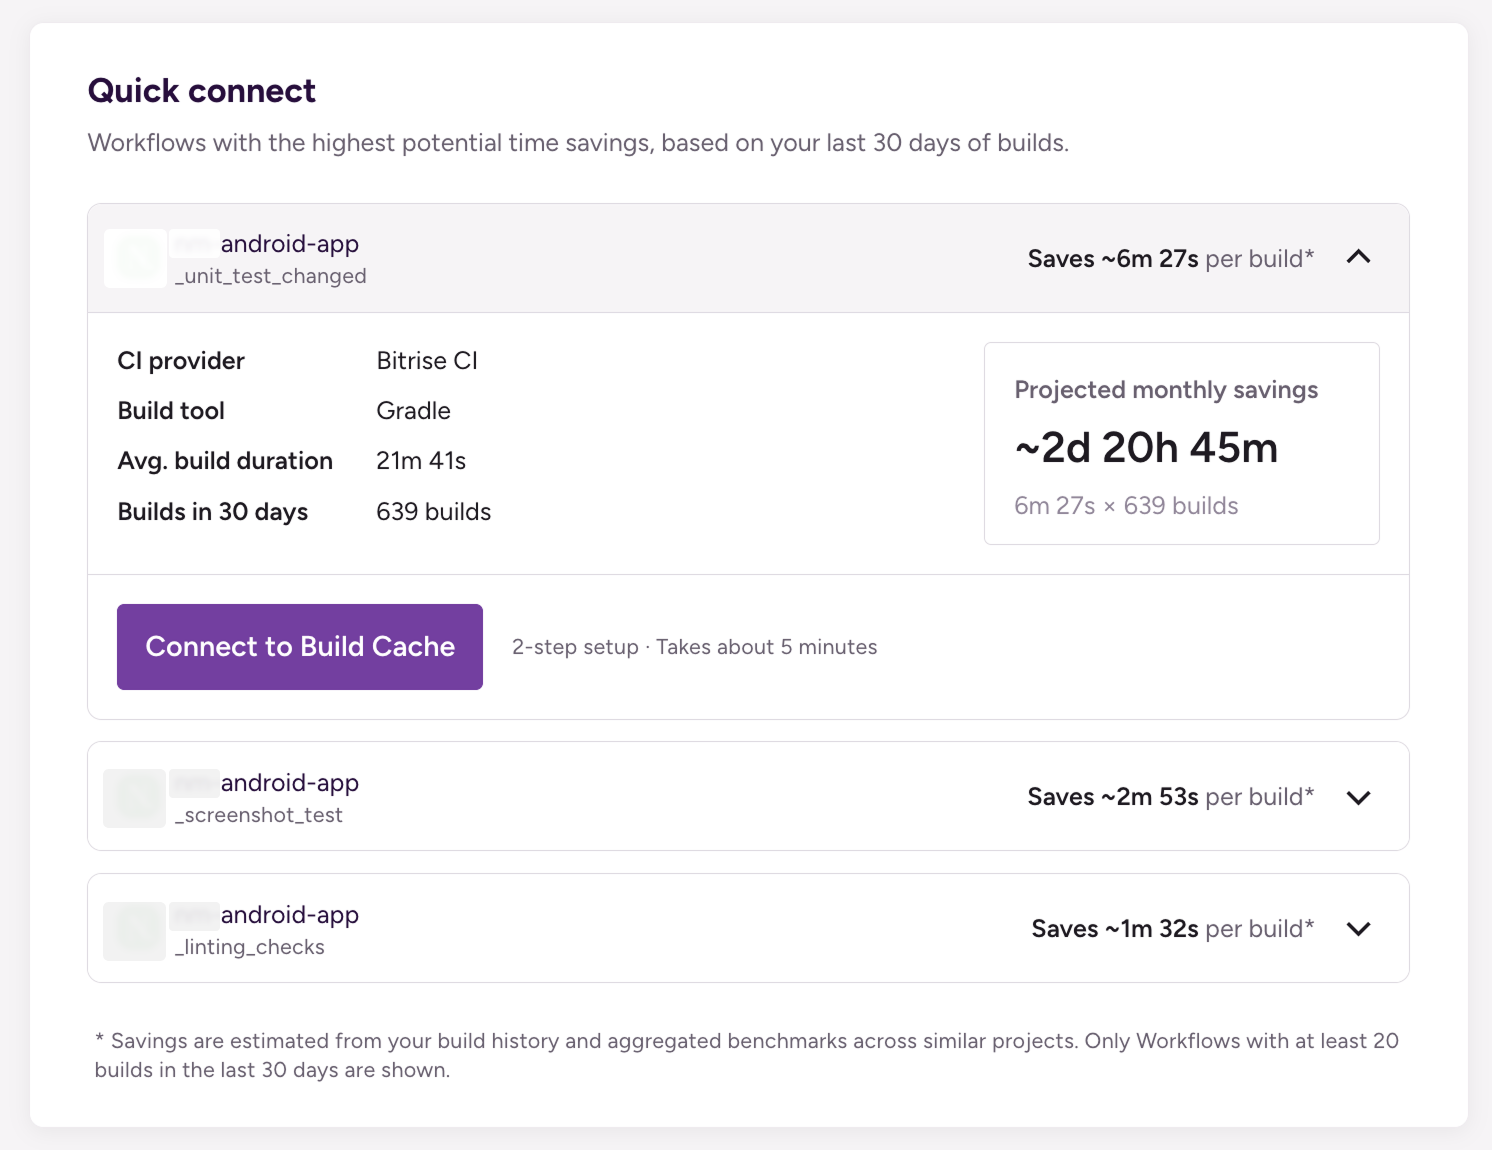
Quick Connect surfaces up to three of your workflows with the highest potential time savings, based on your last 30 days of builds. You can access the list anytime by clicking the Setup Build Cache button.
When you select a workflow, you'll be guided through a setup flow to configure it. This involves adding a step in the workflow editor, so make sure you have the right access level to edit the workflow. Once the step is added, run a few builds to warm up the cache. After that, sit back and watch your build times drop.
What you get with Quick Connect
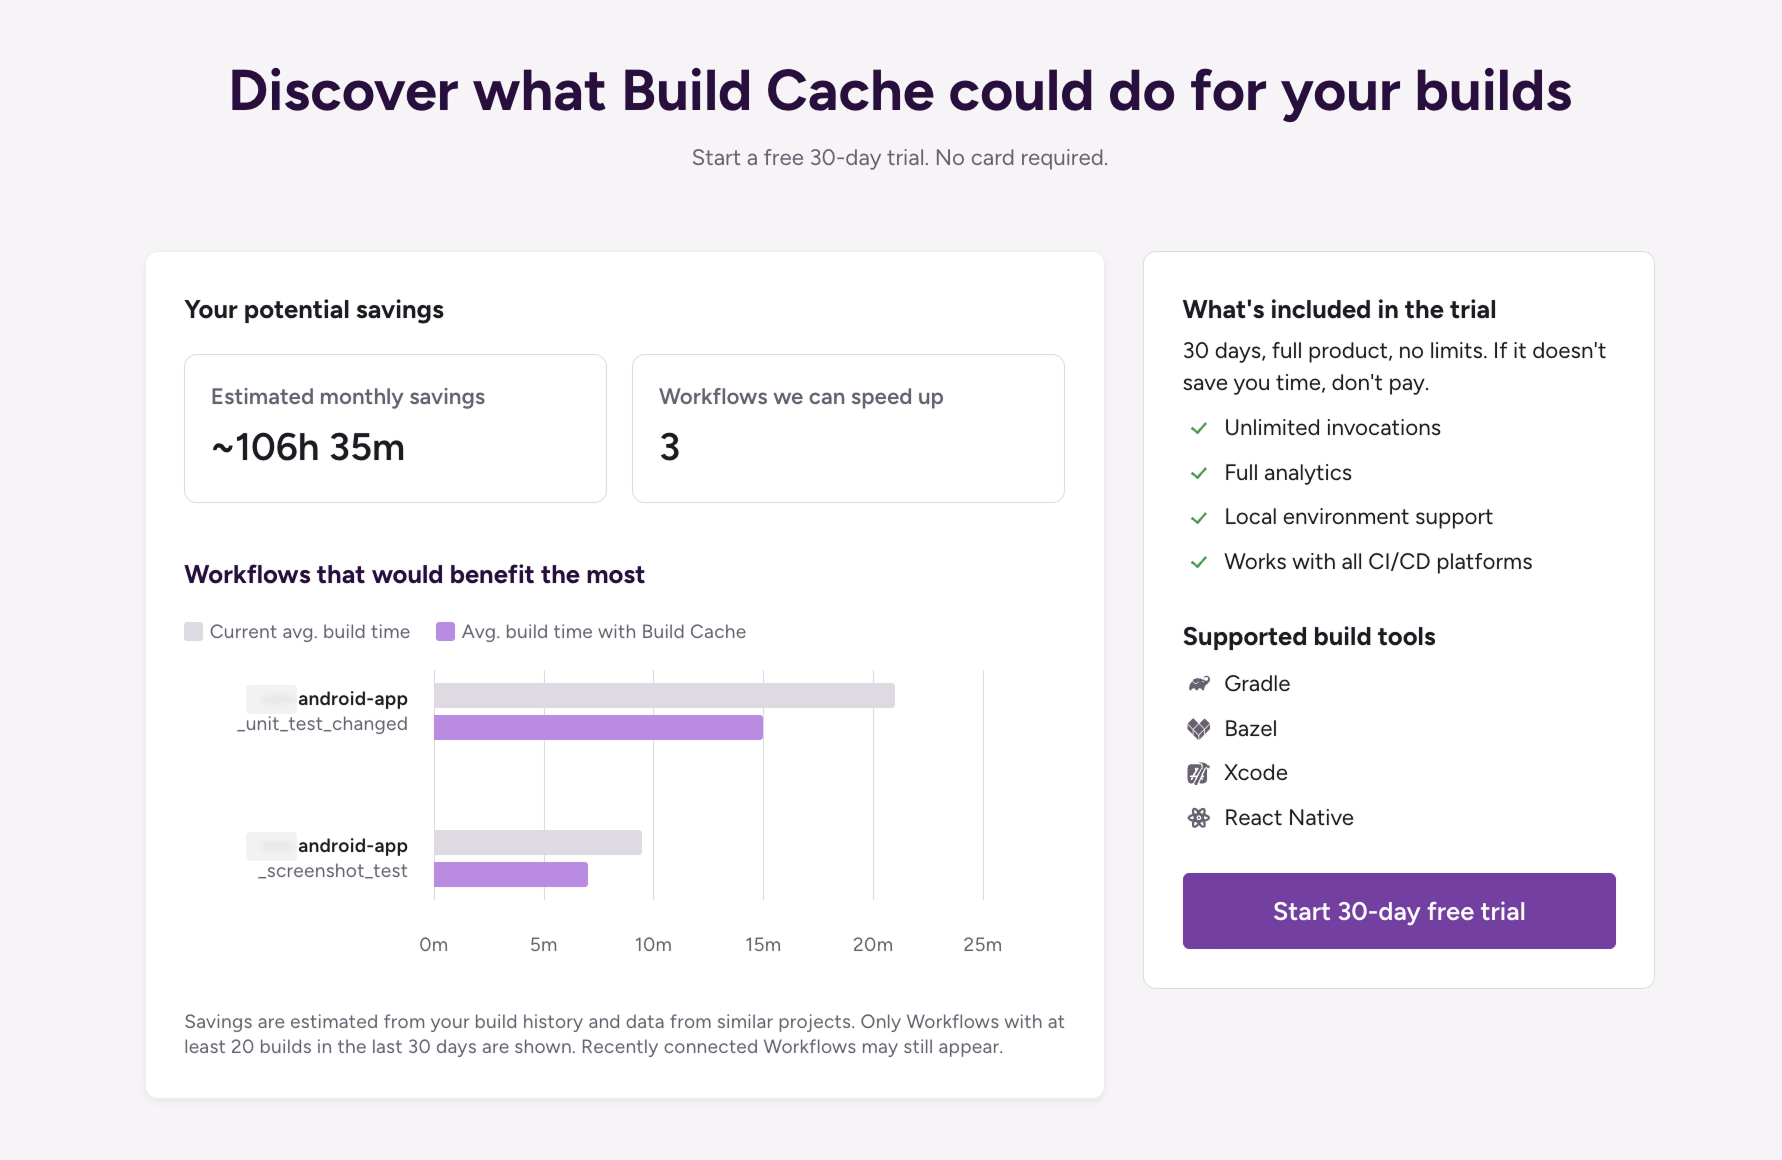
The result is a ranked list of your workflows by projected time savings — per build and monthly — so you can make an informed decision about where to start. The estimates are grounded in real usage data, baseline-vs-warmed-cache comparisons, and the actual composition of your workflows.
It’s still a prediction. Project-specific variables like modularization strategy, task mix, and the scope of typical code changes all affect real-world results. But it’s a much more informed starting point than a single benchmark number: it’s built to help you get to value faster.
Get started for free
Get a 30-day free trial and join the 400,000+ mobile developers who already love Bitrise.
Start free trial